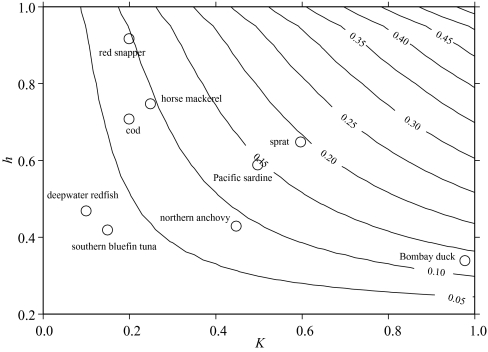
Figure 4.
Contours of yield biomass ratios (Y/ExB0) for different values of K and h. Also shown are estimates of yield biomass ratios for selected fish species, based on estimates for those species of h from Myers et al. (1999) and of K from FishBase (Froese & Pauly 2004). A constant value of Lc of 0.5 has been assumed for each species.

