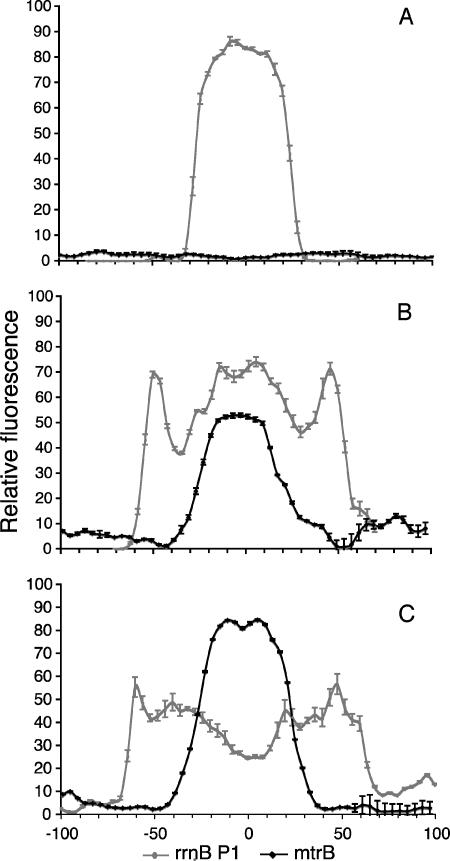
FIG. 6.
Quantitative analysis of patterns of growth activity and metabolism in S. oneidensis biofilms. The gray lines show growth activity profiles for strain DKN310 (rrnB P1), and the black lines show mtrB expression of strain DKN312. (A) Biofilm structures approximately 60 μm in diameter. (B) Structures approximately 110 μm in diameter. (C) Structures approximately 140 μm in diameter. Each line represents an average of a minimum of six different structures. The error bars indicate the standard deviations of the binned pixel intensity values for all the images included in the plot. For panels B and C, local minima at the edges of the colonies are regions with no cells, thought to be extracellular polysaccharide. The patterns of expression relative to the size of the biofilm structure are remarkably consistent across multiple structures, and mtrB continues to be expressed in regions where growth activity has decreased.

