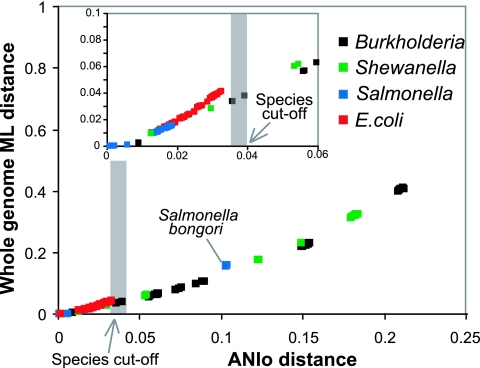
FIG. 1.
Genetic diversity within each of the four bacterial groups studied, based on the ML and ANIo measurements. Each square represents a pair of genomes from one group, colored according to the group to which the genomes belong (see legend). Whole-genome ML distances between two genomes in the pair (y axis) are plotted against their ANIo distances (x axis). The gray area corresponds to the current species cutoff for bacteria.

