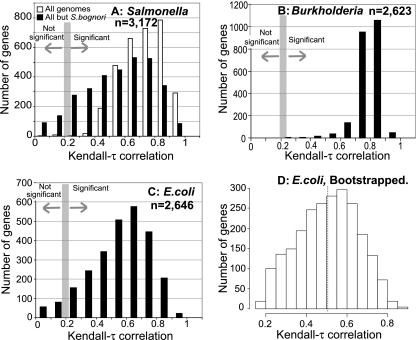
FIG. 2.
Performance of individual genes against the whole-genome average. The individual-gene-based distance matrix for all genome pairs in a group was compared to the ANIo matrix for the same genome pairs by using the nonparametric Kendall τ correlation test. Graphs show the distribution of the Kendall τ values for all core genes within a group (1, perfect correlation; 0, no correlation). The area that corresponds to a significant correlation (P < 0.05) is also designated. The E. coli (A), Salmonella (B), and Burkholderia (C) groups are shown. Panel D shows the distribution of the Kendall τ values for the genes in the E. coli group, which were significant, as determined by the bootstrap approach (see Materials and Methods for details). n, number of genes.

