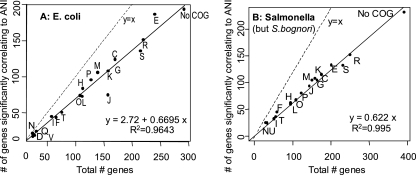
FIG. 5.
Functional annotations of the genes with significant correlation with ANIo values. The number of genes with significant correlation with ANIo (Kendall τ correlation > 0.221, P < 0.05) (y axes) is plotted against the total number of genes in a COG functional category (x axes). Using a higher cutoff for Kendall τ correlation (e.g., >0.35) does not change the results shown. The letters on the graphs correspond to the COG individual functional categories according to the category designations on the COG website (http://www.ncbi.nlm.nih.gov/COG/).

