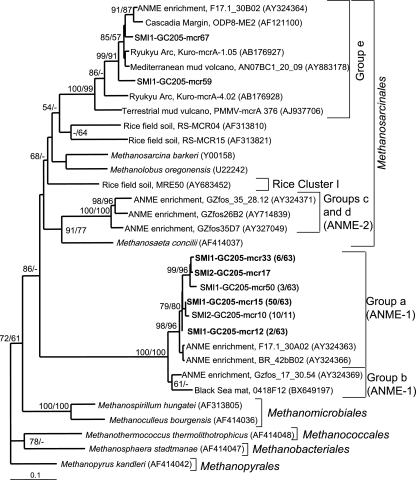
FIG. 3.
Least-squares distance tree based on translated partial amino aid sequences of PCR-amplified mcrA genes from GC205 sediment depths SMI-1 (15 to 18 cm) and SMI-2 (18 to 21 cm) (boldface). Group names are based on those of Hallam et al. (17). Bootstrap values (percent) for 1,000 repetitions each of distance (first) and parsimony (second) are listed for values of >50%. Groups that have >99% similar nucleic acid sequences within each sediment depth are represented by a single sequence, with the number of clones out of the total in parentheses. Environmental clones are included for comparison and are designated by their location or environmental type, clone name, and GenBank accession number. The scale bar represents 10% estimated distance.

