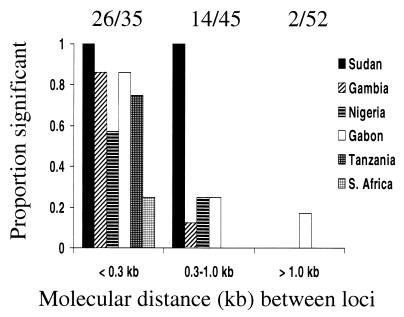
Figure 2.
Proportions of significant linkage disequilibrium tests between pairs of loci within the msp1 gene in each of six countries, according to molecular distance between the loci. Overall proportions are shown above the histogram, illustrating a highly significant decline with increasing molecular distance (P < 10−7, see text).

