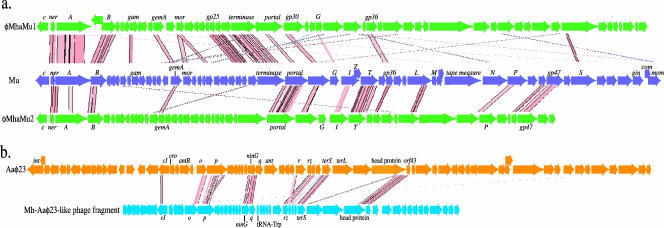
FIG. 2.
Bacteriophage maps. The Artemis comparison tool (9) was used to plot Tblastx matches of M. haemolytica prophage sequences to Mu and Aaφ23. Red and pink lines indicate similar regions; darker lines represent higher-quality matches. a. Comparison of φMhaMu1 and φMhaMu2 to Mu. b. Comparison of the Aaφ23-like prophage to Aaφ23.

