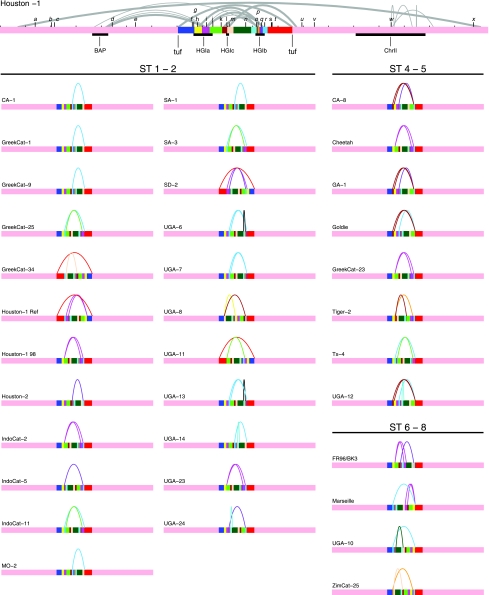
FIG. 4.
Schematic illustration of rearrangements in 35 B. henselae strains inferred by probe hybridizations to PFGE blots. Linear representation of the Houston-1Seq genome is at the top, with the positions of the hybridized probes shown in black letters (a to x). The locations of the prophage (BAP), the GEIs (HGIa, HGIb, and HGIc), and the chromosome II-like region (ChrII) are indicated as black boxes. Inverted repeats in the B. henselae genome are indicated as half-circles, with the length of the repeat proportional to the thickness of the line. The inverted repeats were identified by REPuter (41); only repeats over 200 bp and with a maximal edit distance of 20 are shown. When there are several repeats flanked by the same probes or restriction sites, only the longest repeat is shown. The Houston-1Seq genome is divided into colored segments by the breakpoints of the inferred rearrangements with end points at the duplicated tuf genes. Below, the inferred order of the segments is shown for each isolate (grouped by sequence type), with curved lines indicating the inferred inversions and translocations. Detailed information of restriction sites and inference of rearrangement scenarios are shown in Fig. 1 in our supplementary information at the website http://www.egs.uu.se/molev/suppl.data/J.Bacteriol.

