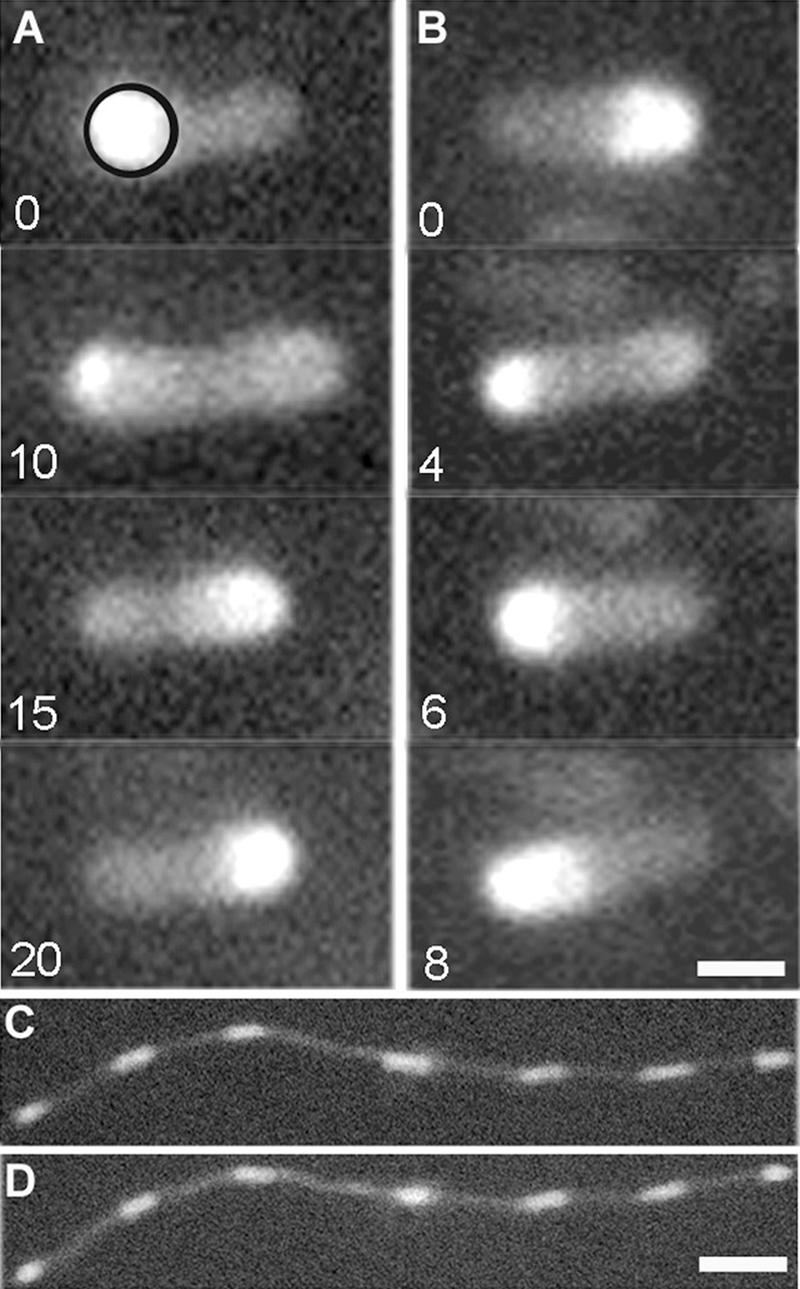
FIG. 1.

Oscillation of MinD concentration within E. coli bacteria. (A and B) (A) Fluorescence images of strain PB103 at 22°C at 0, 10, 15, and 20 s, giving an oscillation period of approximately 40 s. The circle in the top panel indicates the region over which the time dependence of the average polar fluorescence intensity was determined, as discussed in the text. (B) At 30°C, the oscillation period of the same strain (PB103) is now significantly shorter, approximately 16 s. Images at 0, 2, 4, and 8 s are shown. A temperature-independent pattern of growth and dissolution of the MinD polar caps can be seen. Bar, 1 μm. (C and D) Fluorescence patterns in filamentous strain PB114 at (C) 22°C and (D) 30°C. A temperature-independent characteristic wavelength of the MinD oscillations can be seen. Bar, 6 μm.
