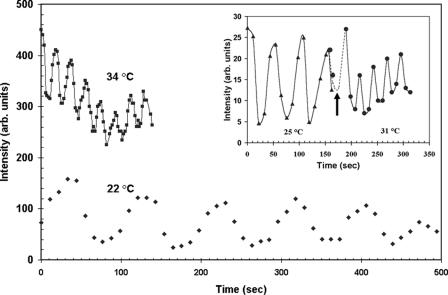
FIG. 2.
MinD polar intensity versus time for a single bacterium of strain PB114. The average intensity in a circular region (illustrated in Fig. 1A) initially placed over a fluorescence maximum is plotted as a function of time. Diamonds indicate the 22°C imaging temperature, while squares indicate 34°C (vertically offset for clarity). The lines through the data points are aids to the eye. The dramatic period reduction from 89 s to 18 s between the two temperatures is evident. The inset shows the rapid response of the oscillation period to a 6°C temperature step. A slower 51-s period at 25°C is illustrated by triangles before the arrow. At the time indicated by the arrow, but in an independent experiment, the temperature is raised within seconds to 31°C and a shorter period of 26 s is observed to occur immediately (circles). The two dots before the time of the arrow are from the bacterium that underwent the temperature increase. arb. units, arbitrary units.

