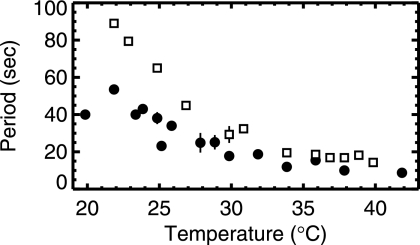
FIG. 3.
Period of MinD oscillation versus temperature. Filled circles denote rod-shaped cells from strain PB103, while open squares indicate filamentous cells from strain PB114. The vertical bars indicate standard deviations when multiple measurements were taken at the same temperature. A strong and systematic decrease of oscillation period with increasing temperature is evident.

