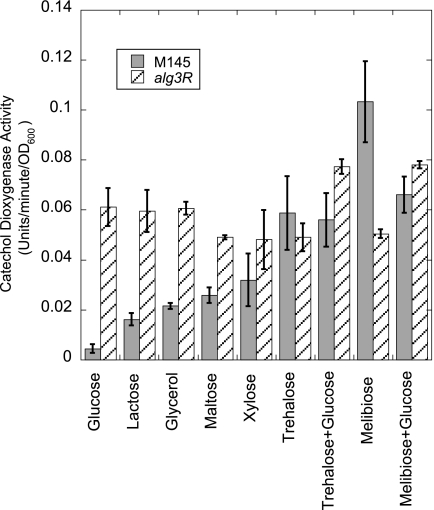
FIG. 5.
Histogram showing the results of quantitative catechol dioxygenase assays from cells grown on various carbon sources. The darkly shaded bars are data from wild-type (M145) cells, and hatched bars are data from assays of the agl3R mutant, each containing a transcriptional fusion between the xylE reporter gene and the promoter region of agl3E.

