Abstract
The anaerobic metabolism of phenol proceeds via carboxylation to 4-hydroxybenzoate by a two-step process involving seven proteins and two enzymes (“biological Kolbe-Schmitt carboxylation”). MgATP-dependent phosphorylation of phenol catalyzed by phenylphosphate synthase is followed by phenylphosphate carboxylation. Phenylphosphate synthase shows similarities to phosphoenolpyruvate (PEP) synthase and was studied for the bacterium Thauera aromatica. It consists of three proteins and transfers the β-phosphoryl from ATP to phenol; the products are phenylphosphate, AMP, and phosphate. We showed that protein 1 becomes phosphorylated in the course of the reaction cycle by [β-32P]ATP. This reaction requires protein 2 and is severalfold stimulated by protein 3. Stimulation of the reaction by 1 M sucrose is probably due to stabilization of the protein(s). Phosphorylated protein 1 transfers the phosphoryl group to phenolic substrates. The primary structure of protein 1 was analyzed by nanoelectrospray mass spectrometry after CNBr cleavage, trypsin digestion, and online high-pressure liquid chromatography at alkaline pH. His-569 was identified as the phosphorylated amino acid. We propose a catalytic ping-pong mechanism similar to that of PEP synthase. First, a diphosphoryl group is transferred to His-569 in protein 1, from which phosphate is cleaved to render the reaction unidirectional. Histidine phosphate subsequently serves as the actual phosphorylation agent.
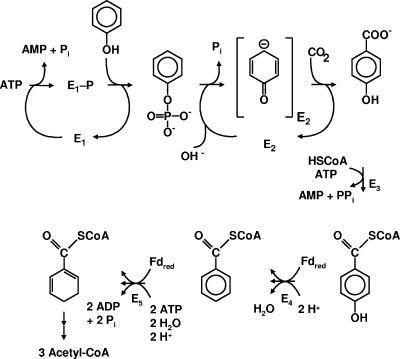
Phenolic compounds constitute the second most abundant class of organic compounds in nature, next to carbohydrates. They serve as various natural growth substrates for microorganisms. In addition, phenolic compounds are prominent environmental pollutants. Aerobic metabolism of phenolic compounds requires phenol oxygenases and molecular oxygen, which serves as a hydroxylating and ring cleavage cosubstrate. In contrast to aerobic metabolism, anaerobic metabolism, e.g., in oxygen-free ground water, cannot rely on oxygenase-dependent degradation steps. Therefore, enzymes of anaerobic metabolism of phenol promise unprecedented features. This process has been studied so far mainly for the denitrifying beta-proteobacterium Thauera aromatica (11, 14-16, 20-23). It proceeds via para-carboxylation of phenol (“biological Kolbe-Schmitt carboxylation”) (2) and involves two initial steps. The outline of this pathway (6-8, 10, 13, 16, 21), which contains unique enzymes, is illustrated in Fig. 1.
FIG. 1.
Outlines of anaerobic metabolism of phenol, as studied for the denitrifying bacterium T. aromatica (20). The proposed reaction scheme for phenylphosphate synthase is hypothetical and is studied here. E1, phenylphosphate synthase studied here; E2, phenylphosphate carboxylase; Fdred, reduced ferredoxin; E3, 4-hydroxybenzoate-coenzyme A (CoA) ligase (AMP forming); E4, 4-hydroxybenzoyl-CoA reductase (dehydroxylating); E5, benzoyl-CoA reductase (aromatic ring reducing).
In the first step, phenol is converted to phenylphosphate. This reaction is catalyzed by phenylphosphate synthase (16). Its molecular and catalytic features (EC 2.7.9.-) resemble those of phosphoenolpyruvate synthase (EC 2.7.9.2) (19), albeit with interesting modifications. The catalyzed reaction is described by equation 1 (referred to as the net phosphorylation reaction).
 |
(1) |
The phosphoryl group in phenylphosphate is derived from the β-phosphate group of ATP. The whole reaction (equation 1) may be understood as the sum of equation 2 and equation 3.
 |
(2) |
 |
(3) |
According to this proposal, the enzyme E becomes phosphorylated by ATP (equation 2) and the phosphorylated enzyme is supposed to subsequently transform phenol to phenylphosphate (equation 3). These features suggest a ping-pong mechanism. Consistent with this hypothesis, the enzyme also catalyzes an exchange of free [14C]phenol and the phenol moiety of phenylphosphate (equation 4, referred to as the phenol exchange reaction).
 |
(4) |
This indicates that the enzyme also becomes phosphorylated by phenylphosphate in the course of the phenol exchange reaction (equations 5 and 6).
 |
(5) |
 |
(6) |
Phenylphosphate synthase consists of three proteins (20) whose genes are located adjacent to each other on a large operon (11). Protein 1, of 70 kDa, resembles the central part of Escherichia coli phosphoenolpyruvate synthase, which contains a conserved histidine residue (3, 4, 19), shown in Fig. 2. Protein 1 alone catalyzes the exchange of free [14C]phenol and the phenol moiety of phenylphosphate (equation 4) but not the phosphorylation of phenol (equation 1) (20). The phosphorylated protein 1 is thought to interact with the substrate phenol and to transfer the phosphoryl group to phenol (equation 3). Phosphorylation of phenol requires protein 1, MgATP, and protein 2, of 40 kDa, which resembles the N-terminal part of phosphoenolpyruvate synthase. Protein 2 may catalyze the phosphorylation of protein 1 (equation 2). A combination of proteins 1 and 2 affords the net phosphorylation reaction (equation 1). The reaction is stimulated severalfold by protein 3, of 24 kDa, which contains two cystathionine-β-synthase domains but does not show significant overall similarity to known proteins (20). The exact role of this 24-kDa protein is unknown.
FIG. 2.
Partial sequence alignment of conserved histidine. Amino acids 550 to 578 of protein 1 from phenylphosphate synthase of T. aromatica are compared with protein 1 from phosphoenolpyruvate synthases of Corynebacterium glutamicum ATCC 13032 (BLAST gi 21323316), Clostridium acetobutylicum ATCC 824 (BLAST gi 15023398), and Bacillus subtilis subsp. subtilis strain 168 (BLAST gi 2634276). The amino acid positions of the shown fragments within the peptides are given by the numbers in front of the alignment. The conserved histidine residues are highlighted in white on a black background. The Basic Local Alignment Search Tool (BLAST) from NCBI was applied. For further information, see reference 20.
This work aimed at studying the proposed reaction mechanism with purified proteins and testing whether the conserved histidine in protein 1 is phosphorylated. While phosphoesters (O-phosphates) are stable under acidic conditions and less stable under basic conditions (18), N-phosphates, such as phosphohistidine, are rapidly hydrolyzed under acidic conditions but quite stable under basic conditions (5, 12). The acidic conditions of most standard procedures make it difficult to identify phosphohistidine residues in peptide sequences. We have solved the problem by employing an analytical column with a basic gradient.
MATERIALS AND METHODS
Materials and bacterial strains.
Chemicals and growth media were purchased from Merck (Darmstadt, Germany), Sigma-Aldrich (Deisenhofen, Germany), Roth (Karlsruhe, Germany), Applichem GmbH (Darmstadt, Germany), Fluka (Neu-Ulm, Germany), and Becton Dickinson (Sparks, Md.). [U-14C]phenol was obtained from American Radiochemicals (Cologne, Germany), and [γ-32P]ATP was from Amersham Pharmacia Biotech (Freiburg, Germany). Argon, helium, and nitrogen gas were from Sauerstoffwerke Friedrichshafen (Friedrichshafen, Germany). Ultrafiltration membranes were obtained from Amicon, Inc. (Beverly, Mass.), and PALL Gelman Laboratories (Ann Arbor, Mich.). Microcon-50 microconcentrators were purchased from Millipore Corporation (Bedford, Mass.). Phosphorimager plates were from Fuji (Tokyo, Japan). Thauera aromatica (DSMZ 6984) (1, 22) has been deposited in the Deutsche Sammlung für Mikroorganismen und Zellkulturen (Braunschweig, Germany). Escherichia coli bacterial strain SURE {e14 (mcrA) Δ(mcrCB-hsdSMR-mrr)171 endA1 supE44 thi-1 gyrA96 relA1 lac recB recJ sbcC umuC::Tn5 (kan) uvrC [F′ proAB lacIqZΔM15 Tn10 (Tetr)]} was obtained from Stratagene (Amsterdam, The Netherlands). Primers used for sequencing of proteins 1, 2, and 3 were purchased from MWG-Biotech AG (Ebersberg, Germany).
Cell growth.
T. aromatica was grown in a mineral salt medium at 37°C under anoxic conditions with phenol, bicarbonate, and nitrate (20). Recombinant E. coli harboring a plasmid containing the gene of protein 1 and that of protein 2, respectively, was grown at 37°C in a 170-liter fermentor (airflow, 65 liter/min; 190 rpm) containing Luria-Bertani medium with 1% Bacto tryptone, 0.5% yeast extract, 1% NaCl, pH 7.5, and 100 mg/liter ampicillin. When an optical density of 0.5 to 0.6 was reached at 595 nm, 0.5 mM (final concentration) IPTG isopropyl-β-d-thiogalactopyranoside) was added for protein overproduction for 3.5 h. Cells were harvested in the exponential growth phase at an optical density of 2.8 to 4.3, which corresponded to 2.6 to 4 g (dry mass) cell/liter. The culture was cooled to 8°C and harvested by continuous-flow centrifugation. For overproduction of protein 3, see reference 20.
Cloning and expression of proteins 1, 2, and 3.
All molecular biological techniques, including cloning and expression of individual proteins, were done as described before (20). The cloned genes were proved by nucleotide sequencing.
Preparation of cell extracts.
Frozen cells were suspended in an equal volume of water containing 0.1 mg/ml DNase I, and the suspension was passed through a French pressure cell at 132 MPa, followed by centrifugation at 100,000 × g for 20 min. Preparations and purifications were performed at 4°C.
Purification of overproduced protein 1.
Purification started from extracts of 20 g (fresh weight) of cells and was carried out at 4°C. A published protocol (20) was followed, except that chromatography on DEAE-Sepharose was replaced by Q-Sepharose chromatography.
(i) Ion-exchange chromatography on Q-Sepharose.
A 50-ml Q-Sepharose column (Amersham Biosciences, Freiburg, Germany) was preequilibrated at a flow rate of 2.5 ml/min with 150 ml of buffer A (20 mM Tris-HCl, pH 8.5, 20% glycerol [wt/vol], 20 mM β-mercaptoethanol), and then 27 ml (containing 55 mg protein/ml) soluble cell extract from 20 g cells was resuspended in 40 ml buffer A and loaded on the column. After 2 bed volumes of washing, a linear 0 to 1 M NaCl gradient (10 column volumes) in buffer A was applied. Protein 1 was eluted at 330 mM NaCl in 90 ml (3.2 mg/ml protein).
(ii) Desalting on Sephadex G-25.
Combined fractions (5 ml) from Mono-Q chromatography (20) containing protein 1 were pooled and concentrated in an Amicon concentrator unit to 2.5 ml and loaded on a 5-ml desalting PD-10 column (Sephadex G-25 material; Amersham Biosciences, Freiburg) which was preequilibrated with 25 ml buffer A. After a wash with 3 ml of buffer A, 3.5 to 4 ml of desalted protein was eluted with another buffer A, and this fraction was concentrated until the protein concentration reached 20 to 40 mg/ml (Amicon concentrator cell with 30-kDa ultrafiltration membrane). Then, the aliquoted protein was frozen in liquid nitrogen and stored at −70°C.
Preparation of proteins 2 and 3.
The preparation of inclusion bodies and protein solubilization were described previously (20). Glycerol, 15% (vol/vol), in the refolding buffer (20 mM Tris-HCl, pH 8.5, 10 mM β-mercaptoethanol) for these proteins (described in reference 20) was replaced by 1 M sucrose. Solutions of refolded proteins were concentrated by pressure filtration (10-kDa cutoff) to 20 to 30 mg protein/ml, frozen in liquid nitrogen, and stored at −70°C.
Enzyme assays.
Isotope exchange activity (equation 4) and net phosphorylation activity (equation 1) were assayed as described in reference 20. Briefly, formation of radiolabeled phenylphosphate was monitored by thin-layer chromatography and radioautography. Quantification was based on quantitative phosphorimaging and comparison with 14C-labeled compounds of known radioactivity, taking into account the specific radioactivity of [14C]phenol.
Protein phosphorylation assay.
A standard enzyme assay mixture (50 μl) contained phenylphosphate synthase subunit proteins 1, 2, and 3 (70 μg, 200 μg, and 125 μg, corresponding to 1 nmol, 5 nmol, and 5 nmol, respectively) in 100 mM Tris-HCl, pH 8.5, 20 mM MgCl2, 1 mM MnCl2, and 40 mM β-mercaptoethanol. Sucrose (1 M) was added to this standard assay since it improved the yield of phosphorylated protein severalfold. Phosphorylation was started by adding 0.1 mM [β-32P]ATP or [γ-32P]ATP with a specific radioactivity of 1,000 to 1,700 Bq/nmol. It should be stressed that some batches of [γ-32P]ATP contained significant amounts of [β-32P]ATP, which needed to be tested by converting ATP to ADP by pyruvate kinase reaction, followed by high-pressure liquid chromatography (HPLC) separation of adenine nucleotides and radiodetection. Otherwise, erroneous incorporation of label, seemingly from the γ-position of ATP, would be observed.
The assay mixture was incubated at 30°C for 30 min, and then the reaction was stopped by withdrawing 5 μl of the phosphorylation mixture and adding it to 10 μl of 2× sodium dodecyl sulfate-polyacrylamide gel electrophoresis (SDS-PAGE) sample buffer containing 100 mM Tris-HCl, pH 6.8, 0.1% SDS, 20% glycerol, 20 mM dithiothreitol, and 0.05% bromphenol blue. Aliquots were subjected to SDS-PAGE (10% polyacrylamide), and the gel was then incubated in 10% glycerol-30% methanol for 10 min, air dried in a thin film, and incubated on phosphorimager plates (Fujix BAS-IP MP 2040; Fuji, Tokyo, Japan) for 24 h. Radiolabeled protein was detected by autoradiography on a phosphorimager analyzer (Molecular Imager FX; Bio-Rad, Hercules, Calif.). Quantification of phosphorylation was performed by liquid scintillation counting of excised gel pieces after the images were scanned.
Protein dephosphorylation assay.
Protein phosphorylation was carried out for 30 min. Then, the assay mixture was kept at either 30°C or 0°C when 1 mM phenol (30°C or precooled on ice) was added and incubated further for dephosphorylation of protein 1. At different time points, samples were withdrawn and analyzed as described above. In case of substrate specificity, the phosphorylation mixture was kept at 30°C and phenol analogues were added (1 mM final concentration) and incubated for 30 min at this temperature.
Chemical stability of phosphorylated protein.
After phosphorylation of protein 1, 50-μl aliquots were mixed with 1 M HCl and 1 M NaOH, respectively, and incubated at 40°C. At different time points, aliquots were withdrawn and analyzed as mentioned above.
Inhibition of phosphorylation reaction.
Phenylphosphate synthase subunit proteins 1, 2, and 3, as with the protein phosphorylation assay, were added to 100 mM N-2-hydroxyethylpiperazine-N′-2-ethanesulfonic acid-NaOH, pH 7.5 (because of diethylpyrocarbonate instability at alkaline pH), 20 mM MgCl2, 1 mM MnCl2, 40 mM β-mercaptoethanol, and 100 mM diethylpyrocarbonate. The assay mixture was incubated at 20°C for 10 min to inhibit the putative histidine phosphorylation site. Then, 0.1 mM [β-32P]ATP (specific activity of 1,000 Bq/nmol) was added and incubated for another 10 min. An aliquot of 5 μl from this mixture was withdrawn and analyzed as described above.
Other methods.
Synthesis of [β-32P]ATP was performed as described before (20), protein concentration was determined by the Bradford method (9), and SDS-polyacrylamide gel (10% and 12.5%) electrophoresis was carried out by the Laemmli method (17).
Preparation of phosphorylated protein for mass spectrometric analysis.
To remove sucrose, a phosphorylated protein mixture (50 μl) was concentrated by centrifugation with a Microcon centrifugation filtration unit (Millipore Corporation, Bedford, Mass.) (50-kDa nominal molecular mass limit) at 10,000 × g for 5 min and washed by centrifuging with 450 μl test buffer containing 100 mM Tris-HCl, pH 8.5, 20 mM MgCl2, 1 mM MnCl2, and 40 mM β-mercaptoethanol. When 20 μl of phosphorylation mixture was left, 200 μl of 50 mM NH4HCO3-8 M urea, pH 7.3, was added; the mixture was then incubated for 10 min at 20°C and centrifuged at 5,000 × g for 30 min. During the centrifugation, the flowthrough was constantly removed. When 65 μl of phosphorylation mixture was left, it was collected from the concentrator unit, shock frozen in liquid nitrogen, and stored at −70°C.
Mass spectrometry of protein.
The intact protein (in Tris-HCl buffer, pH 8.6) was acidified with 5% formic acid in water (pH of <3), and an aliquot was desalted through an SPE column (Agilent Technologies, Böblingen, Germany) with reversed-phase Poros 10 R1 material (packed into a 1-μl pipette tip) and eluted directly into a nanospray needle mounted to the nanoelectrospray ionization (nano-ESI) source of a Finnigan linear trap-Fourier transform (LTQ-FT) mass spectrometer (Thermo Electron Corporation, Waltham, Mass.).
Mass spectrometry of peptide fragments. (i) Tryptic digestion.
About 0.5 μg/μl of protein was dissolved in 8 M urea-50 mM NH4HCO3, reduced by adjusting the solution to 10 mM dithiothreitol, and incubated for 30 min at 60°C. Cysteines were modified by adjustment of the solution to 50 mM iodoacetamide and incubation for 30 min at 37°C. After dilution of the sample with 50 mM NH4HCO3 to a urea concentration of <0.8 M, 1 to 2 μg of trypsin in buffer (Promega) was added and CaCl2 adjusted to 1 mM. The digestion occurred overnight at 37°C.
(ii) Cyanogen bromide cleavage.
After modification of cysteines, an aliquot of the protein solution was mixed with an excess (200-fold) of CNBr dissolved in 70% acetic acid and incubated overnight at room temperature in the dark. The sample was lyophilized and the peptide fragments separated by reversed-phase HPLC (Waters 996/600E column YMC C18, 150 by 4.6 mm, 55 μm, 12 nm). Individual fractions were collected and measured offline with an ESI LTQ-FT mass spectrometry (MS) system. The monoisotopic masses (resolution of 200,000 at m/z of 400) of the fragments were detected.
(iii) Phosphohistidine detection.
For detection of phosphohistidine by HPLC-MS, the digestion solution was injected with a FAMOS autosampler, desalted online on a trap column (XTerra MS C18, 3.5 μm, 100 μm [inside diameter] by 10 mm), and separated on an analytical column with an emitter tip (XTerra MS C18, 3.5 μm, 75 μm [inside diameter] by 800 mm) with a basic gradient (pH, 10; A, H2O, 3% acetonitrile, 10 mM NH4OH; B, 80% acetonitrile, 10 mM NH4OH); the gradient was 22 min to 100% A, 4 min to 70% A, and 16 min to 40% A.
RESULTS AND DISCUSSION
Phosphorylation of protein 1 and requirements of the reaction.
The three proteins involved in the ATP-dependent phosphorylation of phenol were recombinant proteins. They were incubated with 100 μM [β-32P]ATP for 30 min at 37°C, either alone or in various combinations. The samples were analyzed by SDS-PAGE, followed by phosphorimaging to detect phosphorylated protein (Fig. 3) and to quantify radioactivity in labeled protein bands. Quantification by phosphorimaging was calibrated by liquid scintillation counting of the labeled protein. None of the proteins alone became phosphorylated. However, when protein 1 (20 μM) was combined with protein 2 (100 μM), one radioactive protein band, which was identical with the protein 1 band, appeared. The degree of labeling increased severalfold when protein 3 (100 μM) was also included. However, the combination of proteins 1 and 3 did not result in protein 1 phosphorylation. None of the bands of the other two proteins (proteins 2 and 3) were labeled (Fig. 3, series a).
FIG. 3.
Requirements for phosphorylation of protein 1. In the phosphorylation assay, different combinations of proteins 1, 2, and 3 were incubated with 0.1 mM [β-32P]ATP. After 30 min of incubation at 30°C, samples were retrieved and separated on SDS-PAGE gels, followed by phosphorimaging of labeled protein bands. Only the protein 1 band was labeled, and it is shown here in the autoradiogram of phosphorylated protein 1. Series a, absence of (−) sucrose; lane 1, 7 μg of protein 1; lane 2, 20 μg of protein 2; lane 3, 12.5 μg of protein 3; lane 4, 7 μg of protein 1 and 20 μg of protein 3; lane 5, 7 μg of protein 1 and 20 μg of protein 2; lane 6, 20 μg of protein 2 and 12.5 μg of protein 3; lane 7, 7 μg of protein 1 (1 nmol), 20 μg of protein 2 (5 nmol), and 12.5 μg of protein 3 (5 nmol). Series b, loaded proteins are as described for series a but with phosphorylation in the presence of (+) 1 M sucrose. For details of the phosphorylation assay, see Materials and Methods.
It was found that refolding of proteins 2 and 3 from inclusion bodies in the presence of 1 M sucrose dramatically increased their activity in the phenylphosphate synthase assay. Therefore, it was tested whether addition of 1 M sucrose had any effect on protein 1 phosphorylation (Fig. 3, series b). Indeed, sucrose drastically increased the amount of phosphorylated protein 1, and in the presence of high sucrose concentration, the addition of protein 3 did not result in further increase of labeling in protein 1. This lack of effect of protein 3 may be explained by the assumption that under this condition protein 1 was already nearly maximally phosphorylated, the estimated amount corresponding to 0.75 nmol of phosphate incorporated per 1 nmol of protein 1. Addition of 30% (wt/vol) glycerol had little effect, and addition of 30% (wt/vol) polyethylene glycol 600 had no effect. When 100 μM [γ-32P]ATP was used instead of [β-32P]ATP, no labeled protein was visible in the autoradiogram when proteins 1 and 2 were added (not shown; see Materials and Methods). The dependence of the degree of protein 1 phosphorylation with 0.1 mM [β-32P]ATP on proteins 2 and 3 at different molar ratios was tested at a fixed concentration of protein 1 in the presence of 1 M sucrose (Table 1). When the ratio of protein 1 to protein 2 of 1:5 reached the highest phosphorylation of protein 1 (0.35 mol/mol protein 1), protein 3 (1, 2, and 5 mol) was added. A molar ratio of protein 1:protein 2:protein 3 of 1:5:1, which corresponded to 0.55 nmol of phosphate per 1 nmol protein 1 at this low ATP concentration, was optimal. Note, however, that part of the proteins may have been inactivated in the course of their purification and that this ratio therefore probably does not reflect the molar ratio of subunits in a protein complex.
TABLE 1.
Dependence of protein 1 phosphorylation with 100 μM [β-32P]ATP on amounts of protein 2 and protein 3a
| Protein ratio (mol:mol) | % Pi incorporated into protein 1b |
|---|---|
| Protein 1:protein 2 | |
| 1:0 | 0 |
| 1:1 | 11 |
| 1:2 | 33 |
| 1:5 | 50 |
| Protein 1:protein 2:protein 3 | |
| 1:5:1 | 100 |
| 1:5:2 | 100 |
| 1:5:5 | 100 |
Tested in the presence of 1 M sucrose. The assay mixture (50 μl) contained 100 mM Tris-HCl, pH 8.5, 20 mM MgCl2, 1 mM MnCl2, 40 mM β-mercaptoethanol, 100 μM [β-32P]ATP, 1 M sucrose, 7 μg of protein 1 (20 μM), and various amounts of protein 2 (20 to 100 μM) and protein 3 (20 to 100 μM). Incubation was carried out at 30°C for 30 min. For further details, see Materials and Methods.
One hundred percent equals the degree of protein 1 phosphorylation under optimal conditions in the presence of protein 3.
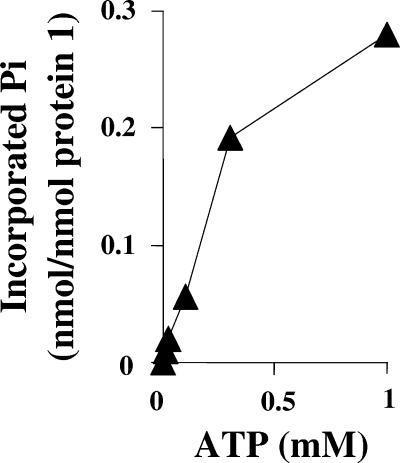
So far, the test was performed in the presence of 100 μM of β-32P-labeled ATP and with 20 μM protein 1. This low ATP concentration was purposely used to increase the sensitivity of the assay by maintaining a high specific radioactivity of 32P-labeled ATP. The apparent Km value of phenylphosphate synthase for ATP was 2 mM, and it is likely that 100 μM ATP was rate limiting. Therefore, the amount of phosphorylated protein 1, dependent on the ATP concentration, was determined with increasing ATP concentrations at a constant amount of radioactivity, i.e., with decreasing specific radioactivity of [β-32P]ATP (Fig. 4). The radioactivity in protein 1 was quantified, and the amount of phosphorylated protein was calculated. The percentage of phosphorylated protein 1 increased with ATP concentration and slowly leveled off. Under the optimal assay condition, with still nonsaturating 1 mM ATP concentration, it was estimated that approximately 30% of protein 1 was in the phosphorylated form. The calculation assumes single phosphorylation of protein 1. This figure might indicate that under saturating ATP concentration almost all protein 1 can become phosphorylated.
FIG. 4.
Dependence of protein 1 phosphorylation by [β-32P]ATP on the concentration of ATP. Note that a constant amount of radioactivity (50,000 Bq per 50 μl assay mixture) was applied, i.e., the specific radioactivity of ATP decreased with increasing ATP concentration. The assay was carried out as described in the legend for Fig. 3 but using various ATP concentrations. Double determination, a deviation of ±5%.
Dephosphorylation of phosphorylated protein 1 by substrate and substrate analogues.
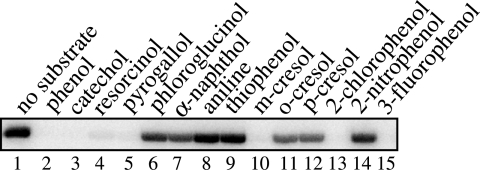
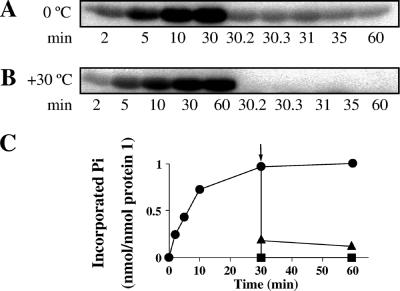
The proposed catalytic mechanism assumes that an enzyme phosphate is transiently formed in the catalytic cycle. Consequently, phosphorylated protein 1 should become dephosphorylated when the substrate phenol (apparent Km value of 0.04 mM in the phenylphosphate synthase assay) or similar substrate analogues are added at 1 mM concentration. This was in fact observed, as shown in Fig. 5. However, the phosphorylated product has not been identified. Hence, the dephosphorylation could also have been caused by a specific stimulation of hydrolysis. Phenol, catechol (1,2-dihydroxybenzene), resorcinol (1,3-dihydroxybenzene), pyrogallol (1,2,3-trihydroxybenzene), m-cresol (3-methylphenol), 2-chlorophenol, and 3-F-phenol completely dephosphorylated protein 1, whereas α-naphthol, o-cresol (2-methylphenol), and p-cresol (4-methylphenol) were less efficient. The phosphorylation of phenolic compounds other than phenol itself may indicate that these compounds, if they serve as growth substrates, are metabolized similarly to phenol. Little or no dephosphorylation occurred with phloroglucinol (1,3,5-trihydroxybenzene), aniline, thiophenol, and 2-nitrophenol. The time course of phosphorylation of protein 1 at 30°C and its dephosphorylation by phenol at 30°C and 0°C are shown in Fig. 6. Addition of phenol instantly resulted in dephosphorylation, and only at 0°C did small amounts of the protein stay phosphorylated. This may be due to stabilizing at low temperature a form of the enzyme that is no longer able to transfer the phosphoryl group to the substrate.
FIG. 5.
Dephosphorylation of 32P-labeled protein 1 by the substrate phenol and substrate analogues (each 1 mM). Lane 1, control in which phenol was not added; lanes 2 to 15, 1 mM of phenol and substrate analogues, respectively, were added as shown. The mixture (50 μl) containing 1 nmol of protein 1, 1 nmol of protein 2, 5 nmol of protein 3, and 1 mM [β-32P]ATP (1,750 Bq/μl) was incubated at 30°C for 30 min. Then, substrate (analogue) was added and incubated further for 30 min at 30°C. For details, see Materials and Methods.
FIG. 6.
Time course of phosphorylation of protein 1 (20 μM) with 100 μM [β-32P]ATP at 30°C and dephosphorylation by 1 mM phenol (A) at 0°C to slow down the reactions and (B) at 30°C. (C) The data were quantified by liquid scintillation counting of 32P-labeled protein 1 spots which were excised from SDS-PAGE gels. The arrow indicates addition of phenol. ▴, dephosphorylation at 0°C; ▪, dephosphorylation at 30°C; •, phosphorylation at 30°C without the addition of phenol. The assay conditions were the same as those described in the legend for Fig. 5. Double determination, a deviation of ±5%.
Stability of the enzyme phosphate bond.
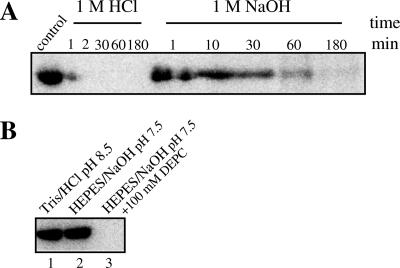
Various amino acids can be phosphorylated, e.g., aspartate and glutamate (phosphoric acid-carboxylic acid mixed anhydride bond), serine, threonine, and tyrosine (phosphate ester bond), and histidine and lysine (phosphoamidate bond). Of these phosphorylated amino acid residues, only the anhydride and the amidate bonds have a group transfer potential which is high enough to phosphorylate phenol quantitatively. The option of which amino acid residue becomes phosphorylated can be discriminated by investigating the stability of the phosphate bond under various conditions (see the introduction). Acid pH (0.1 M HCl) and alkaline pH (0.1 M NaOH) were tested. Also, it was tested whether 100 mM diethylpyrocarbonate prevented the phosphorylation of protein 1; diethylpyrocarbonate is known to carboxylate the histidine and cysteine (Fig. 7). In the case of histidine modification, carboxylation is reversed upon the addition of hydroxylamine. The phosphate bond was quite stabile under alkaline conditions but not under acidic conditions. Furthermore, diethylpyrocarbonate inhibited the phosphorylation of the protein. The phosphorylation of protein 1 after the removal of excess diethylpyrocarbonate and a treatment by hydroxylamine was not tested because of the instability of the phosphoramidate bond in the presence of hydroxylamine (12).
FIG. 7.
Stability of phosphorylated protein. (A) Protein 1 was phosphorylated for 30 min at 30°C (pH 8.5) with [β-32P]ATP in the presence of protein 2 and protein 3. Then, 0.1 volume of 1 M HCl, 1 M NaOH, and 1 M NH2OH-KOH, pH 7.2, respectively, was added to the samples, followed by incubation at 40°C. At various time points, 5 μl of samples was withdrawn and analyzed for radioactive protein 1 by SDS-PAGE, followed by phosphorimaging. (B) Inhibition of phosphorylation of protein 1 by diethylpyrocarbonate (DEPC). Lane 1, control phosphorylation in 100 mM Tris-HCl, pH 8.5; lane 2, control phosphorylation in 100 mM HEPES-NaOH, pH 7.5; lane 3, phosphorylation mixture incubated with 100 mM diethylpyrocarbonate in HEPES-NaOH, pH 7.5, buffer for 10 min at 20°C, followed by addition of 5 μl of [β-32P]ATP, with a final concentration of 0.1 mM (1,000 Bq/μl). After 30 min of incubation for phosphorylation at 30°C, 5 μl of samples was withdrawn, mixed with 10 μl of 2× SDS sample buffer, and analyzed by SDS-PAGE (10% polyacrylamide). For details, see Materials and Methods.
Analysis of protein 1 by mass spectrometry.
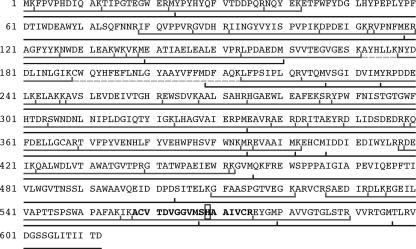
The mass of purified protein 1 was measured by nanoelectrospray mass spectrometry. An average mass of 70,488 ± 30 Da was observed (data not shown), which is 228 ± 30 Da higher than the average mass of 70,260.1 Da calculated from the DNA-derived sequence of 612 amino acids shown in Fig. 8. Peptide mapping after either enzymatic digestion by trypsin or chemical cleavage by CNBr was used to determine the localization and nature of one or more amino acid modifications. After tryptic digestion, 51 of the 63 predicted peptides could be detected and sequenced by liquid chromatography-tandem MS, corresponding to a sequence coverage of 72.9%. The identified peptides are marked in Fig. 8. The N-terminal methionine was missing in a fraction of the peptides. After cleavage by CNBr, all except one (amino acids 161 to 208) of 17 predicted peptides were detected and are also marked in the figure. Taken together, we could cover 95.8% of the sequence, except amino acids 172 to 177 and 189 to 208. By nano-HPLC-MS at pH 10, we found the missing tryptic peptides but at a rather low intensity. It seems likely that an unknown modification which may be not fully resistant to alkaline conditions is localized within these regions. However, we cannot rule out that a modification in some other region is removed during the treatment for enzymatic digestion or chemical cleavage.
FIG. 8.
Amino acid sequence of protein 1 derived from the DNA sequence of open reading frame 1 in T. aromatica (GenBank accession no. AJ272115). Amino acid positions are given by the numbers at left. The peptides found by tandem MS after tryptic digestion of the expressed protein 1 are indicated by the line and tick marks just below the sequence. The dashed line indicates tryptic peptides found by HPLC only under alkaline conditions. The lower line indicates the peptides found after CNBr cleavage. Each peptide has been detected by its mass with high accuracy (0.6 ppm) and additionally identified by fragment ions. The phosphorylation site His-569 is shown in the bold frame.
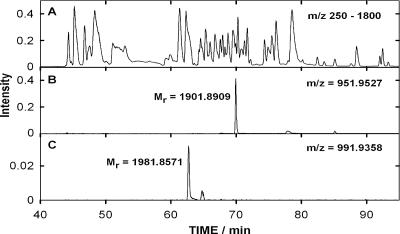
Tryptic or CNBr fragments of protein 1 were separated by improved online nano-HPLC at pH 10 and analyzed by data-dependent tandem-MS measurements. The mass spectrometric data shown in Fig. 9 indicate with high accuracy that it is peptide 558 to 575 (Fig. 8) which includes the phosphorylated amino acid. The fragmentation pattern (not shown) and the sensitivity to acidic conditions strongly support that histidine 569 is the phosphorylated residue.
FIG. 9.
HPLC chromatogram at pH 10 of the tryptic peptides derived from the protein 1 phosphorylation assay containing proteins 1, 2, and 3. (A) Base peak mass in the full scan range of m/z 250 to 1,800. (B) Chromatogram at m/z 951.9527 of the nonphosphorylated tryptic peptide with residues 558 to 575 of protein 1. (C) Chromatogram at m/z 991.9358 of the phosphorylated form of this peptide (found mass 1,981.8571, expected mass 1,981.8573). The column of 75-μm inside diameter had an emitter tip for nano-ESI and a length of 80 mm. Other details are described in Materials and Methods.
Proposed catalytic mechanism.
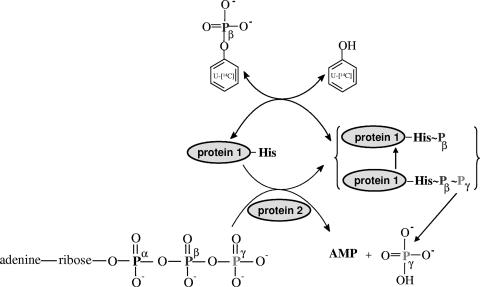
The proposed simplified catalytic mechanism of phenylphosphate synthase is shown in Fig. 10. The isotope exchange reaction catalyzed by the enzyme, i.e., the incorporation of labeled phenol into phenylphosphate, indicated a ping-pong mechanism involving a phosphorylated enzyme. The data presented here show that histidine 569 in protein 1 becomes phosphorylated by [β-32P]ATP in the course of the reaction and then becomes dephosphorylated by the phenolic substrate. We have shown before and confirmed here that the β-phosphate group rather than the γ-phosphate group of ATP becomes incorporated into phenol (8). The hypothetical diphosphorylated intermediate may subsequently hydrolyze the γ-phosphate group, thus rendering histidine phosphorylation irreversible. A similar mechanism has been proposed for, e.g., phosphoenolpyruvate synthase, to which phenylphosphate synthase shows similarity (3, 4, 19). Histidine phosphate is energy-rich enough to phosphorylate phenol. Phenylphosphate is a low-energy phosphate ester, even though its hydrolysis energy is higher than that of a conventional phosphate ester due to the acidity of phenolic hydroxyl functions. Unfortunately, such a diphosphorylated protein 1 could not be detected by mass spectrometry, even when the nonhydrolyzable ATP analogues β-γ-methylene adenosine 5′-triphosphate (AMP-P-C-P) and imidodiphosphate (AMP-P-N-P) were added to the phosphorylation assay.
FIG. 10.
Proposed catalytic cycle of phenylphosphate synthase. The phosphorylation site is that of histidine 569. This hypothetical catalytic mechanism is analogous to the phosphoenolpyruvate synthase mechanism. The scheme shows the net phosphorylation of phenol catalyzed by combined action of protein 1 and protein 2 and the partial reaction, the exchange of free [14C]phenol, and the phenol moiety of phenylphosphate (exchange reaction), catalyzed by protein 1 alone. Note that the role of protein 3 is not explained by this scheme and is elusive.
Unexplained features.
An unknown modification, which may occur in the region of amino acids 172 to 177 or 189 to 208, could not be identified. The determined molecular mass of protein 1 differed from the calculated mass by approximately 228 ± 30 Da. We assume that protein 2 binds ATP, hydrolyzes AMP, and transfers the diphosphate group to protein 1. The stimulation by protein 3 cannot be explained; too little is known about the structure and potential catalytic capability of this protein. The stimulation of protein 1 phosphorylation in the presence of protein 2 by 1 M sucrose may be explained by the low stability of this protein, which was refolded from inclusion bodies in the presence of high concentration of sucrose.
Acknowledgments
This work was supported by the Deutsche Forschungsgemeinschaft (Fu 118/14), the Graduiertenkolleg Biochemie der Enzyme, and the Fonds der Chemischen Industrie.
Footnotes
Published ahead of print on 15 September 2006.
REFERENCES
- 1.Anders, H. J., A. Kaetzke, P. Kämpfer, W. Ludwig, and G. Fuchs. 1995. Taxonomic position aromatic-degrading denitrifying pseudomonad strains K 172 and KB 740 and their description as new members of the genera Thauera as Thauera aromatica sp. nov., and Azoarcus, as Azoarcus evansii sp. nov., respectively, members of the Proteobacteria. Int. J. Syst. Bacteriol. 45:327-333. [DOI] [PubMed] [Google Scholar]
- 2.Aresta, M., and A. Dibenedetto. 2002. Development of environmentally friendly syntheses: use of enzymes and biomimetic systems for the direct carboxylation of organic substrates. J. Biotechnol. 90:113-128. [DOI] [PubMed] [Google Scholar]
- 3.Berman, K. M., and M. Cohn. 1970. Phosphoenolpyruvate synthase of Escherichia coli: purification, some properties, and the role of divalent metal ions. J. Biol. Chem. 245:5309-5318. [PubMed] [Google Scholar]
- 4.Berman, K. M., and M. Cohn. 1970. Phosphoenolpyruvate synthase: partial reactions studied with adenosine triphosphate analogues and the inorganic phosphate-H218O exchange reaction. J. Biol. Chem. 245:5319-5325. [PubMed] [Google Scholar]
- 5.Besant, P. G., and P. V. Attwood. 1998. Problems with phosphoamino acid analysis using alkaline hydrolysis. Anal. Biochem. 265:187-190. [DOI] [PubMed] [Google Scholar]
- 6.Biegert, T., U. Altenschmidt, C. Eckerskorn, and G. Fuchs. 1993. Enzymes of anaerobic metabolism of phenolic compounds. 4-Hydroxybenzoate-CoA ligase from a denitrifying Pseudomonas species. Eur. J. Biochem. 213:555-561. [DOI] [PubMed] [Google Scholar]
- 7.Boll, M., and G. Fuchs. 1995. Benzoyl-coenzyme A reductase (dearomatizing), a key enzyme of anaerobic aromatic metabolism. ATP dependence of the reaction, purification and some properties of the enzyme from Thauera aromatica strain K172. Eur. J. Biochem. 234:921-933. [DOI] [PubMed] [Google Scholar]
- 8.Brackmann, R., and G. Fuchs. 1993. Enzymes of anaerobic metabolism of phenolic compounds. 4-Hydroxybenzoate-CoA reductase (dehydroxylating) from a denitrifying Pseudomonas species. Eur. J. Biochem. 213:563-571. [DOI] [PubMed] [Google Scholar]
- 9.Bradford, M. M. 1976. A rapid and sensitive method for the quantitation of microgram quantities of protein utilizing the principle of protein-dye binding. Anal. Biochem. 72:248-254. [DOI] [PubMed] [Google Scholar]
- 10.Breese, K., and G. Fuchs. 1998. 4-Hydroxybenzoate-CoA reductase (dehydroxylating) from the denitrifying bacterium Thauera aromatrica—prosthetic groups, electron donor, and genes of a member of the molybdenum-flavin-iron-sulfur proteins. Eur. J. Biochem. 251:916-923. [DOI] [PubMed] [Google Scholar]
- 11.Breinig, S., and G. Fuchs. 2000. Genes involved in the anaerobic metabolism of phenol in the bacterium Thauera aromatica. J. Bacteriol. 182:5849-5863. [DOI] [PMC free article] [PubMed] [Google Scholar]
- 12.Duclos, B., S. Marcandier, and A. J. Cozzone. 1991. Chemical properties and separation of phosphoamino acids by thin-layer chromatography and/or electrophoresis. Methods Enzymol. 201:10-21. [DOI] [PubMed] [Google Scholar]
- 13.Harwood, C. S., G. Burchhardt, H. Herrmann, and G. Fuchs. 1999. Anaerobic metabolism of aromatic compounds via the benzoyl-CoA pathway. FEMS Microbiol. Rev. 22:439-458. [Google Scholar]
- 14.Lack, A., I. Tommasi, M. Aresta, and G. Fuchs. 1991. Catalytic properties of phenol carboxylase. In vitro study of CO2: 4-hydroxybenzoate isotope exchange reaction. Eur. J. Biochem. 197:473-479. [DOI] [PubMed] [Google Scholar]
- 15.Lack, A., and G. Fuchs. 1992. Carboxylation of phenylphosphate by phenol carboxylase, an enzyme system of anaerobic phenol metabolism. J. Bacteriol. 174:3629-3636. [DOI] [PMC free article] [PubMed] [Google Scholar]
- 16.Lack, A., and G. Fuchs. 1994. Evidence that phenol phosphorylation to phenylphosphate is the first step in anaerobic phenol metabolism in a denitrifying Pseudomonas sp. Arch. Microbiol. 161:132-139. [DOI] [PubMed] [Google Scholar]
- 17.Laemmli, U. K. 1970. Cleavage of structural proteins during assembly of the head of bacteriophage T4. Nature 227:680-685. [DOI] [PubMed] [Google Scholar]
- 18.Martensen, T. M. 1984. Chemical properties, isolation, and analysis of O-phosphates in proteins. Methods Enzymol. 107:3-23. [DOI] [PubMed] [Google Scholar]
- 19.Narindrasorasak, S., and W. A. Bridger. 1977. Phosphoenolypyruvate synthetase of Escherichia coli: molecular weight, subunit composition, and identification of phosphohistidine in phosphoenzyme intermediate. J. Biol. Chem. 252:3121-3127. [PubMed] [Google Scholar]
- 20.Schmeling, S., A. Narmandakh, O. Schmitt, N. Gad'on, K. Schühle, and G. Fuchs. 2004. Phenylphosphate synthase: a new phosphotransferase catalyzing the first step in anaerobic phenol metabolism in Thauera aromatica. J. Bacteriol. 186:8044-8057. [DOI] [PMC free article] [PubMed] [Google Scholar]
- 21.Schühle, K., and G. Fuchs. 2004. Phenylphosphate carboxylase: a new C-C lyase involved in anaerobic metabolism of phenol in the bacterium Thauera aromatica. J. Bacteriol. 186:4556-4567. [DOI] [PMC free article] [PubMed] [Google Scholar]
- 22.Tschech, A., and G. Fuchs. 1987. Anaerobic degradation of phenol by pure cultures of newly isolated denitrifying pseudomonads. Arch. Microbiol. 148:213-217. [DOI] [PubMed] [Google Scholar]
- 23.Tschech, A., and G. Fuchs. 1989. Anaerobic degradation of phenol via carboxylation to 4-hydroxybenzoate: in vitro study of isotope exchange between 14CO2 and 4-hydroxybenzoate. Arch. Microbiol. 152:594-599. [Google Scholar]


