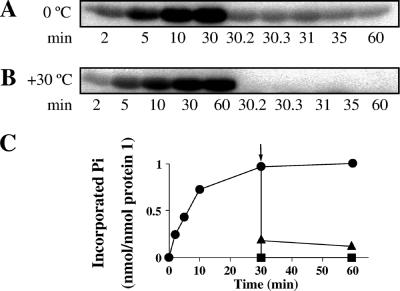
FIG. 6.
Time course of phosphorylation of protein 1 (20 μM) with 100 μM [β-32P]ATP at 30°C and dephosphorylation by 1 mM phenol (A) at 0°C to slow down the reactions and (B) at 30°C. (C) The data were quantified by liquid scintillation counting of 32P-labeled protein 1 spots which were excised from SDS-PAGE gels. The arrow indicates addition of phenol. ▴, dephosphorylation at 0°C; ▪, dephosphorylation at 30°C; •, phosphorylation at 30°C without the addition of phenol. The assay conditions were the same as those described in the legend for Fig. 5. Double determination, a deviation of ±5%.

