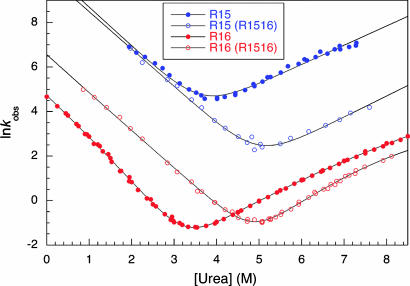
Fig. 5.
Chevron plots for R15 and R16 alone and in R1516. The dependence of the observed rate constants for folding and unfolding against [urea]. Blue filled circles, R15 domain alone; blue open circles, R15 in R1516; the solid lines are fits to a two-state equation. In R1516, R15 is folding and unfolding in the presence of an unfolded R16 domain. The folding rate constants are the same as for R15 alone, but R15 unfolds more slowly in R1516. Red filled circles, R16 domain alone; red open circles, R16 in R1516; the solid lines are fits to a sequential transition state model (41, 42). In R1516, R16 is folding and unfolding in the presence of a folded R15 domain. The R16 domain folds more rapidly and unfolds more slowly in R1516.

