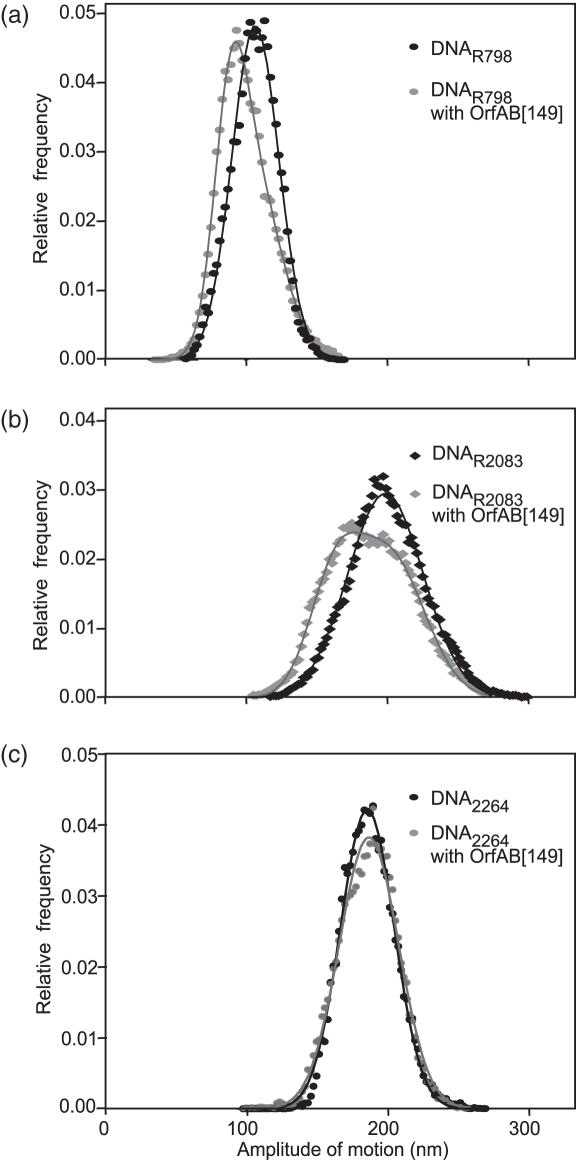
Figure 3.
Visualization of protein binding to a single IRR. The relative frequency distribution of amplitude of motion is presented for various DNA fragments in the presence (grey points) or absence (black points) of OrfAB[149] (see also Table 1): (a) DNAR798: 22 beads analysed without protein, 31 with transposase (b) DNAR2083: 29 beads analysed without protein, 29 with transposase and (c) DNA2264: 22 beads analysed without protein, 23 with transposase. The curves show the Gaussian in the absence of OrfAB[149] or double-Gaussian fit for DNAR798 and DNAR2083 in the presence of OrfAB[149].

