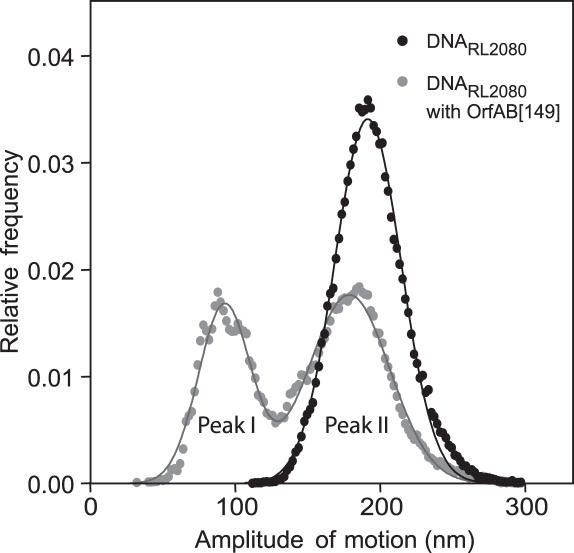
Figure 5.
DNA looping in the presence of two IRs. The relative frequency distribution of the amplitude of motion is represented for DNARL2080 with two IRs in the presence (44 beads analysed) or the absence (35 beads analysed) of OrfAB[149] (in grey and black, respectively). The curves show the Gaussian fit of the distributions in the absence of OrfAB[149] or the triple Gaussian fit in the presence of OrfAB[149].

