Figure 7.
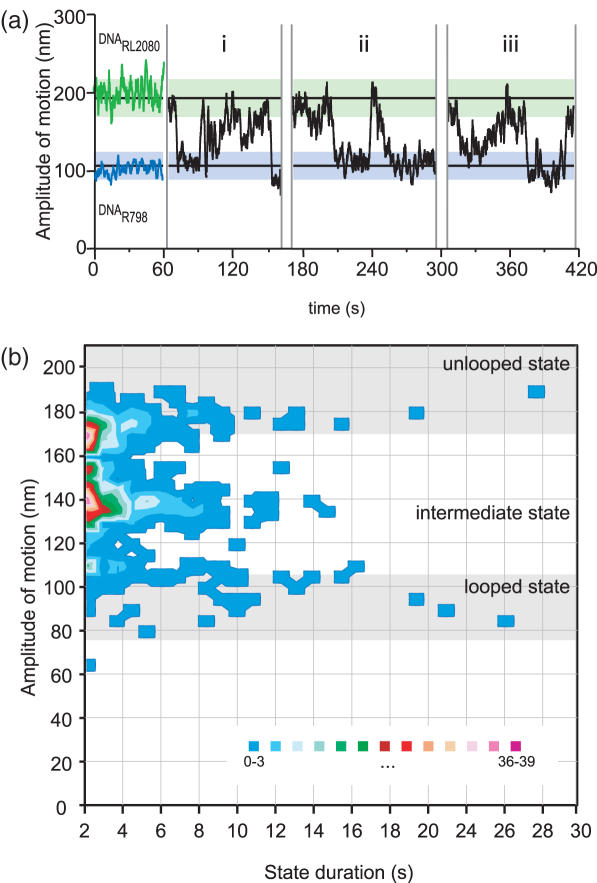
Assembly and disassembly of the synaptic complex in real-time. (a) DNA looping by OrfAB[149]. Typical data traces without protein obtained with DNARL2080 (green shading: 193.1 ± 23.0 nm) and DNAR789 (blue shading: 106.4 ± 16.6 nm) are shown on the left (0–60 s). Different representative traces of looped and unlooped states are shown on the right (i, ii, ii). Transitions (assembly or disassembly) are clearly not always abrupt, but proceed through intermediate states. (b) Histogram of the duration of looped, unlooped, and intermediate states. For each trajectory (n = 24), state duration and amplitude were measured. By ploting these two parameters (688 differents states), the intermediate state appears clearly different from the looped and unlooped DNA (grey shade; looped state: 89.5 ± 15.0 nm; unlooped state: 186.4 ± 17.4 nm).

