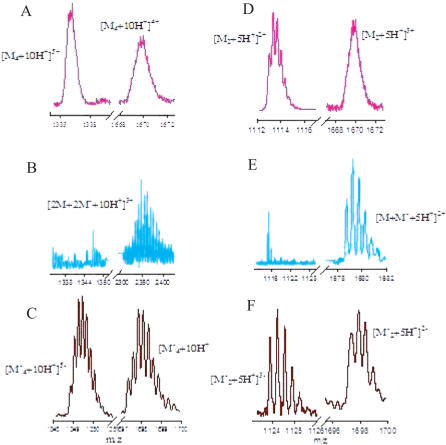
Figure 2.
Nano ESI mass spectra of i-motif tetraplexes and duplexes: (A and C) are representative partial mass spectra showing quadruply and quintuply charged states of PNA4 and DNA4 i-motifs, (B) shows the triply charged state of a tetrameric PNA–DNA complex. (D and F) are representative partial mass spectra showing m/z regimes corresponding to doubly and triply charged states of PNA–PNA and DNA–DNA homoduplexes in the respective PNA4 and DNA4 i-motifs. (E) Shows the doubly charged state of a PNA–DNA heteroduplex in the tetrameric PNA–DNA complex. DNA4 i-motif mass spectra were recorded in negative ion mode.

