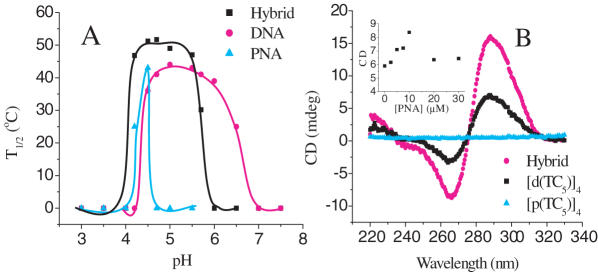
Figure 4.
(A) Plot of the melting temperatures of [p(C5T)]4, [d(TC5)]4 and hybrid tetraplexes, at 25 μM strand concentration, as a function of pH. The lines merely serve as a visual aid. (B) CD profiles of the hybrid, [p(C5T)]4, [d(TC5)]4 tetraplexes at 12.5 μM strand concentration at pH 4.5. Inset shows CD at 288 nm as a function of varying PNA concentration with DNA concentration were fixed at 10 μM.

