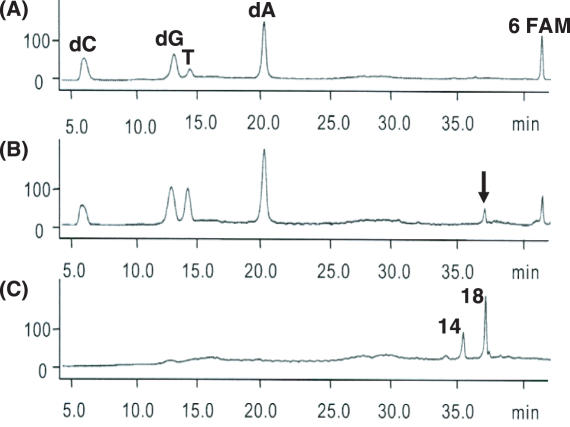
Figure 6.
Enzymatic digesion analysis of an oligonucleotide containing a G-T ICL. (A) HPLC profile of oligonucleotide 6 following enzymatic digestion and dephosphporylation. The four nucleosides and fluorescent label 6-FAM are indicated. (B) HPLC profile of ICL-containing oligonucleotide 10 after enzymatic digestion and dephosphorylation. The peak for the crosslinked T-G residue is denoted by an arrow (C) HPLC profiles of the T(N3)-dG(N1) dimer 14 and the T(N3)-dG(O6) dimer 18.

