Figure 1.
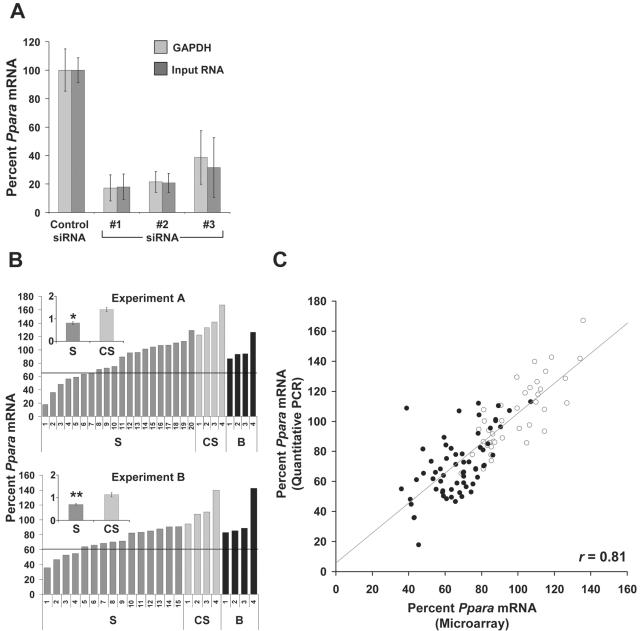
Ppara knockdown with modified siRNAs in vitro and in vivo. (A) Identification of active Ppara siRNAs using transfection of primary mouse hepatocytes. Ppara RT-qPCR measurements are normalized to either GAPDH mRNA or input RNA and are expressed relative to the control siRNA group mean. Bars represent the mean (±SD) for n = 3. (B) In vivo Ppara knockdown. Ppara RT-qPCR measurements are normalized to GAPDH mRNA and are expressed relative to the buffer group mean. Shown are responses to Ppara siRNA#1 treatment at 24 h for individual animals in Experiments A and B. S, Ppara siRNA#1; CS, control siRNA; B, injection buffer only. Line indicates 2 SDs below the buffer group mean. Inset, group means (±SEM); y-axis is %/100; *, P < 0.01; **, P = 0.01. (C) Regression analysis between microarray and RT-qPCR measurements for Ppara mRNA in vivo. For microarray measurements, individual animal data is expressed relative to the pool of buffer only treated animals. For RT-qPCR measurements, individual animal data are expressed relative to the appropriate buffer group mean. Shown are the Ppara mRNA levels for mice in Experiments A, B and C. Animal 20 (Experiment A) and animals 11–15 (Experiment B) were not profiled and are not represented on the chart. Closed circles, Ppara siRNA-treated animals; open circles, buffer and control siRNA-treated animals.

