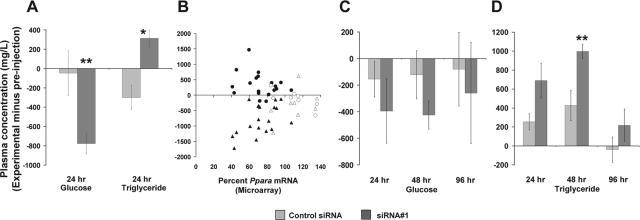
Figure 4.
Effects of Ppara siRNA treatment on plasma concentrations of glucose and triglyceride. (A) Glucose and triglyceride group means of mice in Experiment A (±SEM). (B) Experiment A individual animal responses for glucose (triangles) and triglyceride (circles) relative to microarray measurements for Ppara mRNA (Materials and Methods). Closed symbols, siRNA#1-treated animals; open symbols, control siRNA and buffer-treated animals. (C and D) Experiment C glucose and triglyceride group means (±SEM), respectively. *P < 0.01; **P < 0.05. Pre-injection data were subtracted from experimental values to compensate for base-line drift. Female mice were used in Experiment A and male mice in Experiment C.

