Figure 2.
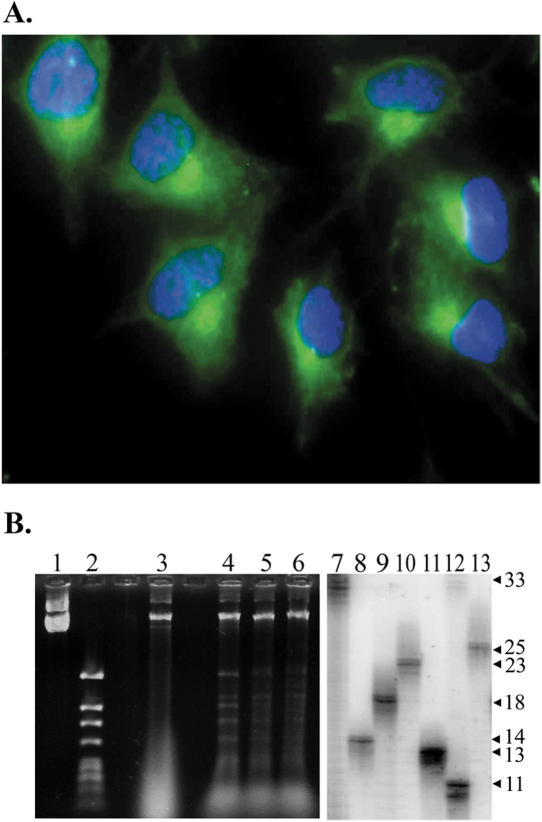
Analysis of SVG-A cells and transfected TNR plasmid DNA. (A) SVG-A cells stained with anti-GFAP antibodies (green false color) and counterstained with DAPI (blue false color) at 400× magnification. (B) DpnI resistance assay after recovery of plasmid pBL248 from SVG-A cells and subsequent PCR analysis of contracted alleles after yeast selection. The left panel shows the result of DpnI digestion of stock plasmid used for background determinations (lane 1 = uncut, lane 2 = cut) and plasmid DNA that has been passaged through SVG-A cells (lane 3 = uncut, lanes 4–6 = cut). Sample wells between lanes 2 and 3 and lanes 3 and 4 were intentionally left empty. The right panel shows the analysis of individual contraction events from SVG-A cells. PCR amplification of starting plasmid DNA indicates the size of the 33-repeat parental allele (lane 7). Individual contractions are shown in lanes 8–13. Fragment sizes, stated as repeat units, were deduced by comparison with molecular weight standards (data not shown).

