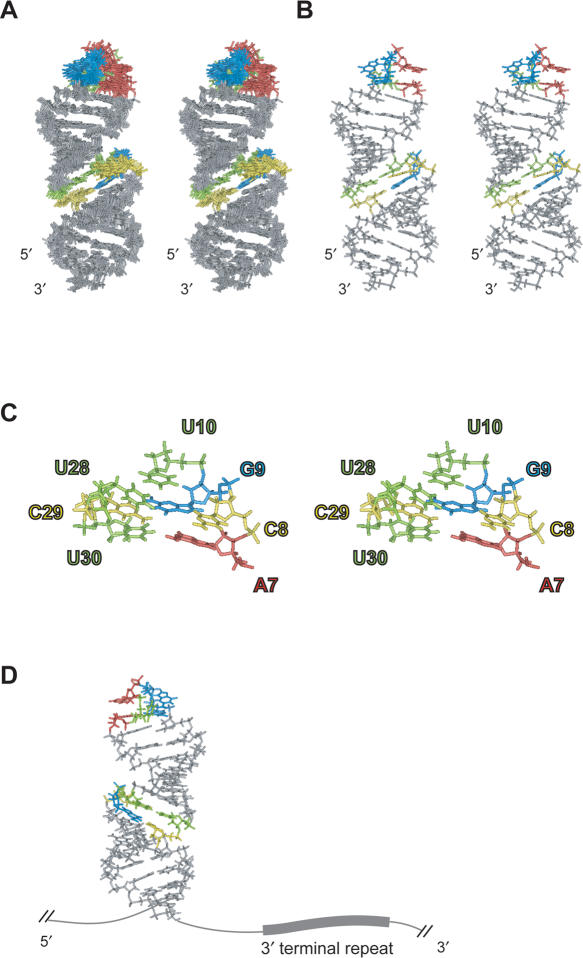
Figure 3.
Solution structures of LINE36. G, A, C and U residues in the GGAUA loop and putative internal loop region are indicated by blue, red yellow and green, respectively. (A) Stereo view of the superposition of the final 10 structures of LINE36. (B) Stereo view of the minimized average structure of LINE36. (C) Stereo view of the bulge region of LINE36 average structure. (D) Location of the second G (blue) in the loop and the 3′-terminal repeat (UGUAA).

