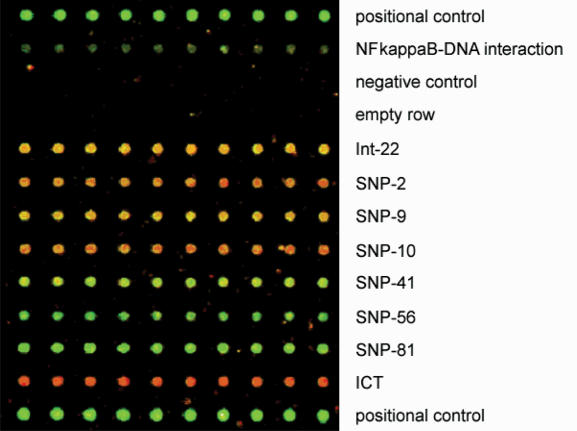
Figure 9.
Combined assay of an analysis of transcription factor binding and SNP-typing. Assays that had been done separately before were performed simultaneously and analysed by a hybridization to a single L-DNA ZIP-code microarray. The top and bottom rows represent Cy3-labelled oligonucleotides, which had been placed to the surface as positional controls. While the mere signal intensity is informative about the interaction of NF-kappaB and DNA, double-labelling had been performed for the SNP-typing. Yellow spots indicate heterozygous samples (Int-22, SNP-9), red signals the presence of a dG in both alleles (SNP-2, SNP-10), while green spots represent homozygous dA sequences. In addition, a Cy5-labelled ICT had been spiked in, hybridizing to a row of ICP oligonucleotides.

