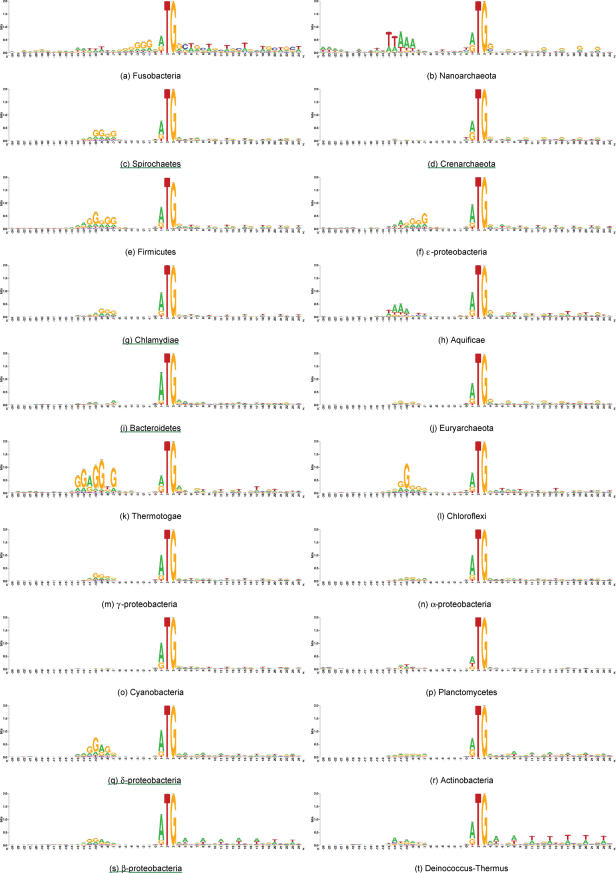
Figure 8.
Corrected and averaged RBS sequence logos of prokaryotic classes. The sequence logos are ordered here by ascending average GC-content of the class. Classes that form sub-clusters on either of the two major principal components (Figure 6b), based on their RBS signal similarity (Table 1), are underlined.

