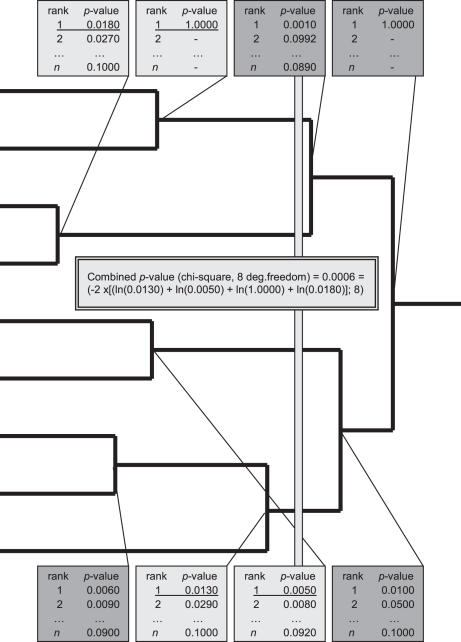
Figure 1.
Fisher's combined probability test is used to calculate the overall P-values for the clusters and to estimate the cutting point of the expression tree. Light gray line illustrates the height that is calculated in the example. Light gray boxes show the selected clusters where the P-values used in the calculus are underlined (the P-value of the best GO-term of the selected cluster).

