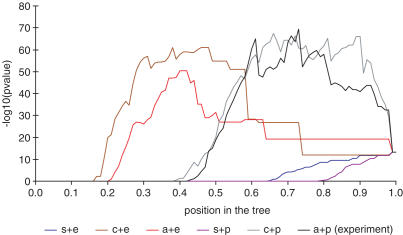
Figure 2.
The behaviour of the overall P-values in expression trees created using different linkage methods and distance metrics. In the figure a, c and s are average, complete and single linkage and e and p are Euclidean and Pearson coefficient correlation distances. The y-axis is the −log10 value of the overall P-value and the x-axis is the position at the tree.

