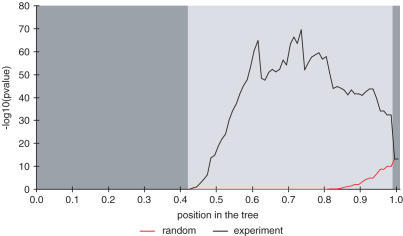
Figure 3.
Reliability of the overall P-values estimated using random permutations. The most significant overall P-values were chosen from the randomised data for each position at the tree. The light grey area indicates those positions of the tree where random analyses yielded less significant overall P-values and the dark grey is an area where all random analyse yielded equal or more significant overall P-values. The left y-axis is the −log10 value of the overall P-value and the x-axis is the position at the tree.

