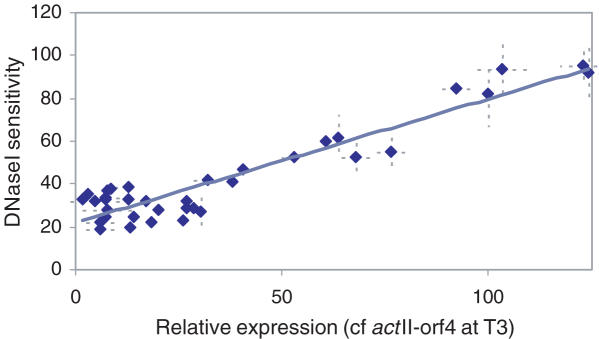
Figure 4.
Transcriptionally regulated genes in S.coelicolor show a positive correlation between DNase I-sensitivity and level of expression. qrt-PCR was used to measure both relative DNase I sensitivity and RNA abundance (Figure 1, lower) for each of the twelve genes used in this study at the three timepoints described. Expression data is relative to the value of actII-orf4 gene at T3 timepoint. Each point is the average of at least three independent measurements with standard deviations shown as dotted lines.

