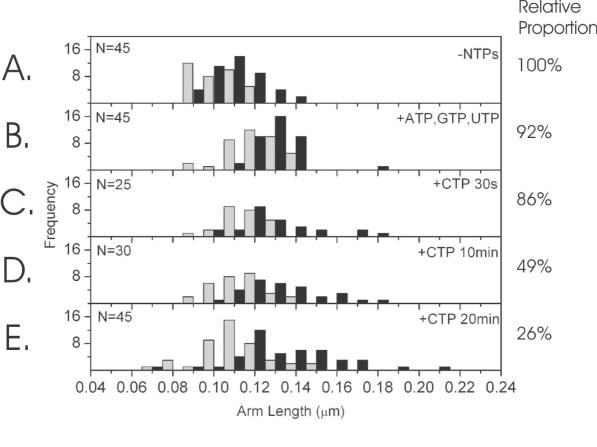
Figure 6.
DNA arm contour length distributions: the grey distribution denotes the short arm and black, the long arm. The DNA contour lengths from the apparent centre of the RNAPs to the respective ends of the DNA molecule: (A) in the absence of NTPs (n = 45); (B) in the presence of ATP, GTP and UTP only (n = 45); and incubation with the final NTP, CTP for (C) 30 s, (D) 10 min and (E) 20 min (n = 25, 30, 45 respectively). The percentages on the right represent the proportion of DNAs within the distribution with 2 RNAP bound, compared to bare DNA and DNA with 1 RNAP bound. The values are normalised to the −NTPs case (panel A).

