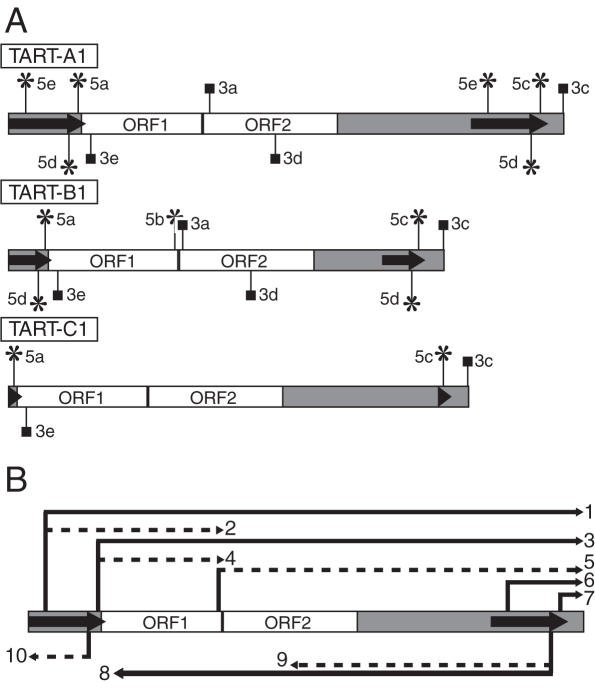
Figure 2.
Relative positions of the 5′ and 3′ ends suggested by RACE analysis and a putative transcript array for TART. Schematic representations of the positions of 5′ and 3′ ends and a putative array of TART transcripts are shown. TART ORFs are indicated by white boxes, the UTRs are indicated by gray regions and the direct repeats are indicated by arrows. The relative lengths of the UTRs correspond to those of TART-A1, -B1 and -C1, but the lengths of UTR sequences vary for other members of each subfamily. (A) Vertical lines ending in asterisks or squares indicate 5′ and 3′ ends, respectively. Each end is distinguished using designations introduced in Figure 1 that appear to the left or right of each vertical line. Those ends drawn above each element correspond to sense transcripts and those drawn below to antisense transcripts. Note that in a few cases a particular end was only identified for one of the three subfamilies (see text). (B) A generic TART element is diagrammed. Arrows above and below the element correspond to potential sense and antisense transcripts, respectively, that could be produced if all the ends shown in (A) are considered. Solid lines represent transcripts supported by previous northern blots of TART transcripts (19) and dotted lines represent transcripts not clearly supported by those same northern blots. Each transcript is numbered at its 3′ end for discussion purposes (see Discussion).

