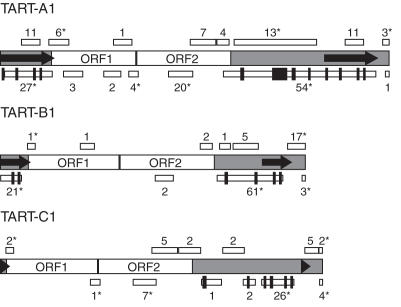
Figure 5.
Regions of TART sequence represented in the GenBank EST database and positions of antisense introns. TART elements are drawn as in previous figures and each drawing is to scale. White boxes above and below each drawing indicate regions of TART sense and antisense sequences, respectively represented in the EST database (note that some boxes are so small that they appear as vertical lines). A number near each box is the number of ESTs with sequences corresponding to the given region of TART. ESTs containing only direct repeat sequences were included in the totals for both the 5′ and 3′ direct repeat regions. Asterisks indicate that the number of ESTs listed includes one or more ESTs that contained sequences from non-contiguous segments of TART and that were counted as representing each of those non-contiguous segments. Black boxes (some of which look like vertical lines) that are taller than the white boxes mark the positions of intron sequences not present in many of the ESTs corresponding to antisense transcripts.

