Figure 2.
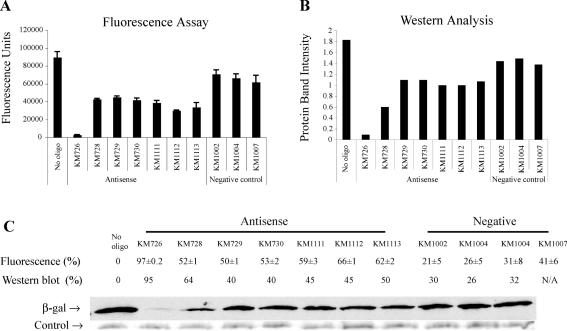
Expression of β-galactosidase was quantified by both a FDG fluorescence assay and Western blot analysis. (A) Values in fluorescence units are shown for each reaction either with or without oligo, as specified. ‘No oligo’ was the control reaction without oligo. KM726, KM728, KM729, KM730, KM1111, KM1112 and KM1113 were designed antisense oligos. KM1002 and KM1004 were random negative controls. KM1007 was a scramble control of KM729. Results shown represent means of triplicate samples from one experiment. Every oligo was tested independently at least three times. Error bars show standard errors for multiple runs of the experiment. (B) Quantification of the Western blot. A total of 40% of the volume of each reaction was analyzed by Western blot. The vertical axis shows the relative intensity of each β-galactosidase protein band from the Western blot as quantified by ImageQuant 5.1 software. (C) Inhibition percentages for results in A (fluorescence) and in B (Western blot) are shown along with the corresponding protein bands from the Western blot. KM1008 was a mismatch control of KM726, which was tested in the fluorescence assay but not in the Western blot. The upper protein bands represent the β-galactosidase detected by chemiluminescence. The lower protein bands are from the Coomassie stained SDS–PAGE gel used for the Western blot assay, and serve as a uniform loading control.

