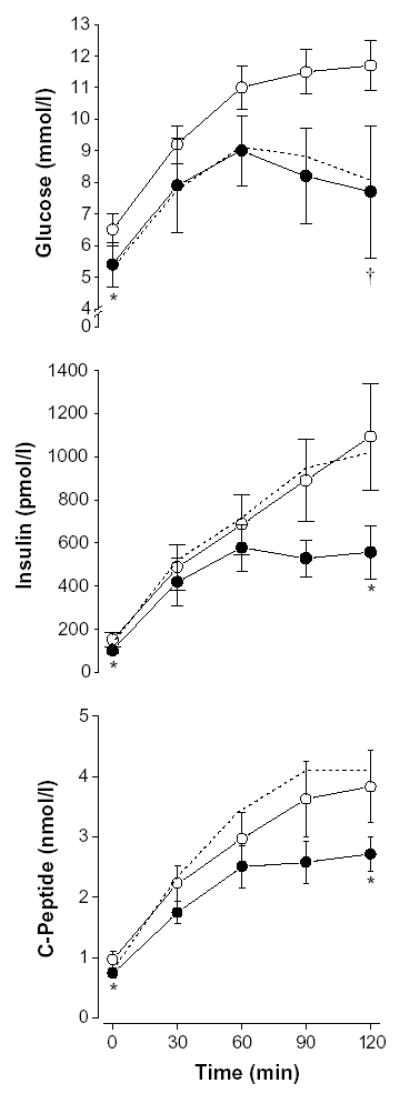
Fig. 1.

Oral glucose tolerance test results for glucose, insulin, and C-peptide at baseline (white circles), after 1 week (dotted line), and after the 1-year intervention (black circles). Asterisk indicates P < .05 for reductions in fasting glucose, insulin, and C-peptide values; 2-hour insulin and C-peptide values; and area under the curve values for insulin and C-peptide (1 year vs baseline). Dagger indicates P < .001 for reductions in 2-hour glucose and glucose area under the curve (1 year vs baseline). Values are mean ± SEM.
