Fig. 3.

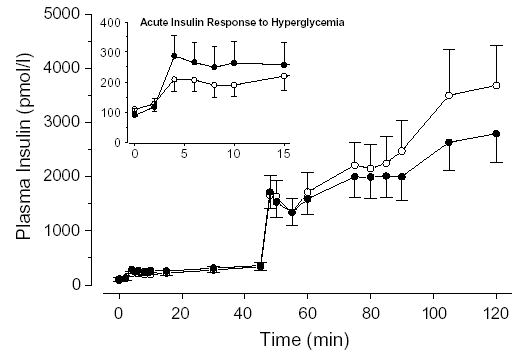
Plasma insulin responses throughout the hyperglycemic clamp before (white circles) and after (black circles) the intervention. The acute insulin response to hyperglycemia (0–15 minutes) is shown (inset).

Plasma insulin responses throughout the hyperglycemic clamp before (white circles) and after (black circles) the intervention. The acute insulin response to hyperglycemia (0–15 minutes) is shown (inset).