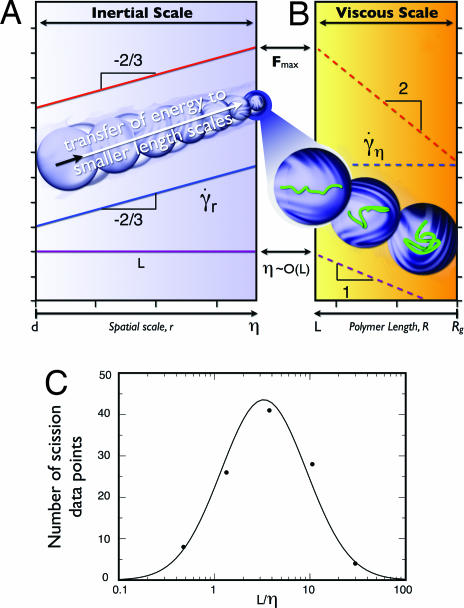
Fig. 3.
Maximum drag force on a polymer chain in the Kolmogorov cascade. The red, blue, and purple lines denote the variables: drag force, strain rate, and polymer length, respectively. (A) Interaction of inertial scales with polymer chain showing that the drag force peaks at r = η. The Inset shows an illustration of the Kolmogorov cascade. (B) Interaction of polymer chain with viscous scale. Here the drag force is maximum when R = L. The Inset shows a chain undergoing stretching from coiled to full extension. (C) Distribution of L/η for the various scission experiments listed in Table 1.

