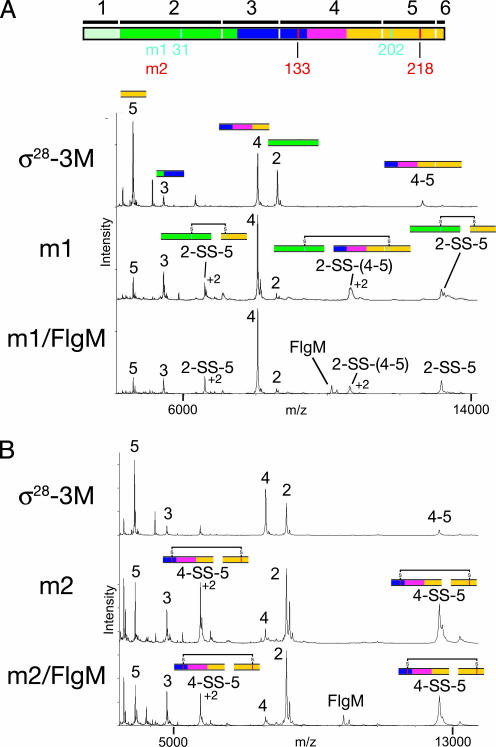
Fig. 2.
MS of CNBr-digested disulfide mutants. A linear diagram of Aae σ28, color-coded as in Fig. 1, is shown at the top of the figure. Methionines (CNBr cleavage sites) are denoted by vertical white lines, with the expected fragments from complete CNBr cleavage denoted by black bars and numbered on top. The positions of the cysteine mutants for m1 (cyan) and m2 (red) are denoted underneath the diagram. (A) Mass spectra of CNBr digests of σ28-3M (top) and mutant m1 without (middle) and with (bottom) FlgM. Peaks are labeled with the fragment number and with colored segments corresponding to the linear diagram at the top of the figure. Peaks with charge state greater than +1 are also labeled with the charge state. (B) Mass spectra of CNBr digests of σ28-3M (top) and mutant m2 without (middle) and with (bottom) FlgM. Peaks are labeled with the fragment number and with colored segments corresponding to the linear diagram at the top of the figure. Peaks with charge state greater than +1 are also labeled with the charge state.

