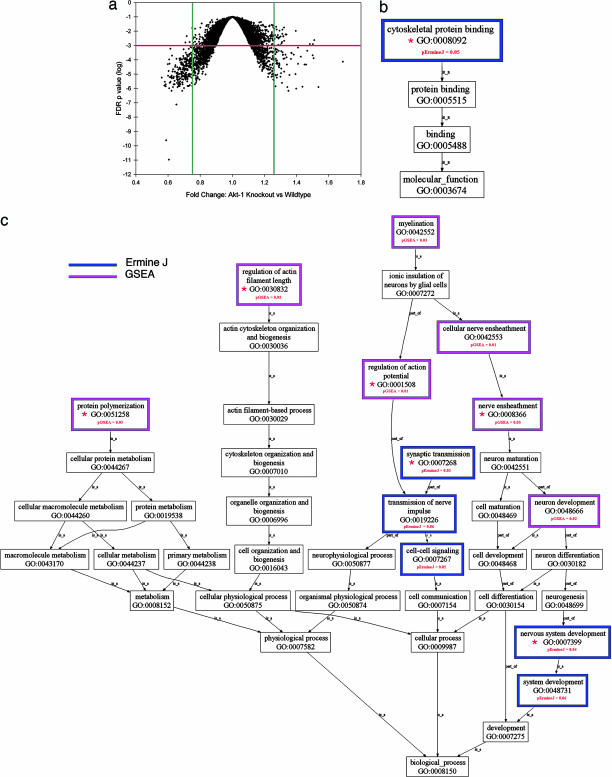
Fig. 1.
Transcriptional profile in the frontal cortex of Akt1-deficient mice. (a) Volcano plot of FDR P values vs. fold changes. Green lines, 25% up- or down-regulation; red line, FDR P = 0.001. (b and c) Gene Ontology (GO) maps, based on ErmineJ and GSEA analyses. Shown are maps for GO-defined molecular functions (b) or biological processes (c) affected in PFC. Red asterisks indicate GO classes shown in detail in Fig. 6 and Table 2.

