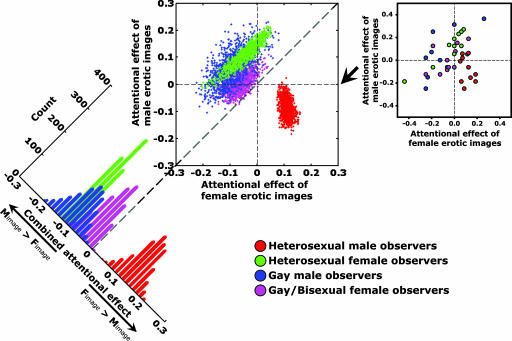
Fig. 3.
Attentional effects (indexed by the difference in performance accuracy of the Gabor patch orientation task) of the invisible erotic images for different participating groups. Different colors indicate heterosexual male (red), heterosexual female (green), gay male (blue), and gay/bisexual female (magenta) observers. Each participant contributed one point in Right. Bivariate distributions of 1,000 bootstrapped sample means for each group are plotted in Center. Horizontal and vertical axes represent the attentional effect of the invisible female and male erotic images, respectively. The bootstrapped sample means were projected onto the diagonal axis for each group (Left). The resulting univariate distributions show a count of points. On this new axis, negative values (left side) indicate that male erotic images attracted more attention, and positive values (right side) indicate that female erotic images attracted more attention.

