FIGURE 3.

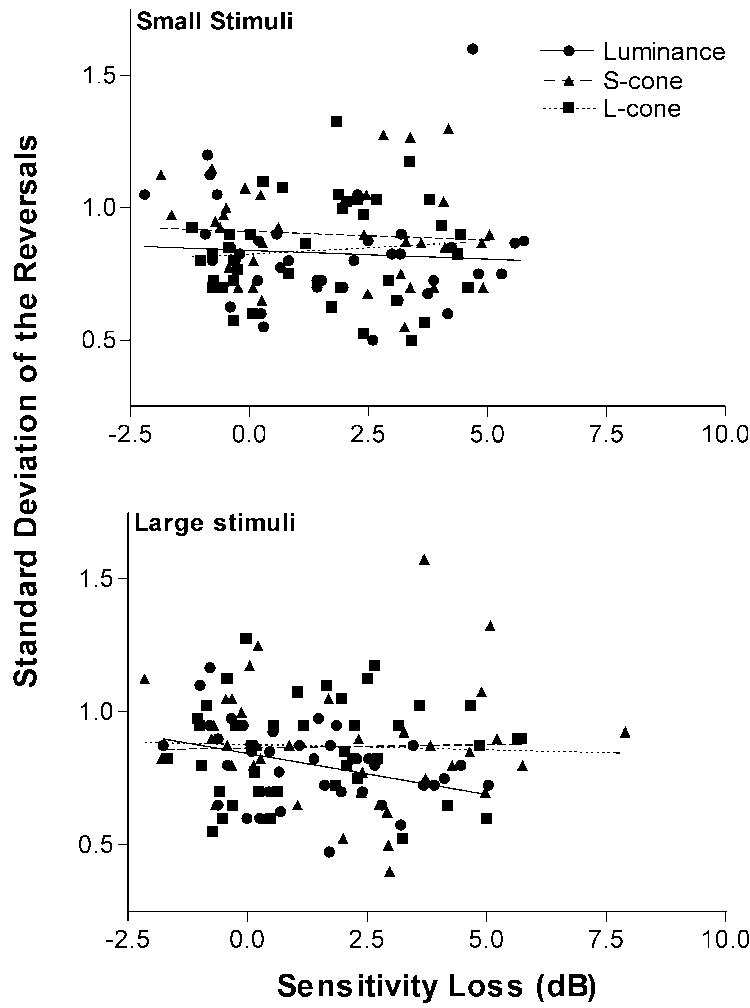
The standard deviation of the reversals is a measure of short-term fluctuation and is shown as a function contrast sensitivity loss for the large (bottom panel) and small (top panel) luminance, S-cone, and L-cone contrast stimuli.

The standard deviation of the reversals is a measure of short-term fluctuation and is shown as a function contrast sensitivity loss for the large (bottom panel) and small (top panel) luminance, S-cone, and L-cone contrast stimuli.