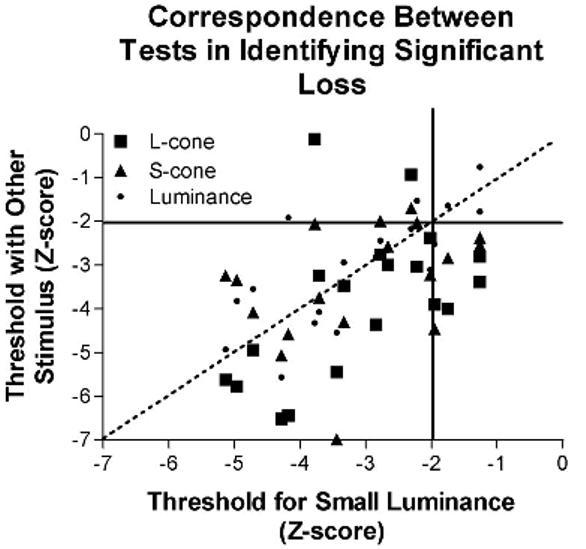
FIGURE 6.

The correspondence between detection of statistically significant visual loss using small achromatic and large chromatic stimuli is illustrated. Statistically significant loss was defined as individual scores that were outside the two-tailed 95% confidence interval for normal (z < −2). One individual whose data fell within normal limits for both the large S-cone contrast stimulus and the large L-cone contrast stimulus also had data outside normal limits for the small luminance stimulus (upper left quadrant). In contrast, four individuals whose data fell within the 95% confidence limits for the small achromatic stimulus were identified by both of the large chromatic tests as falling outside the 95% confidence limits (lower right quadrant).
