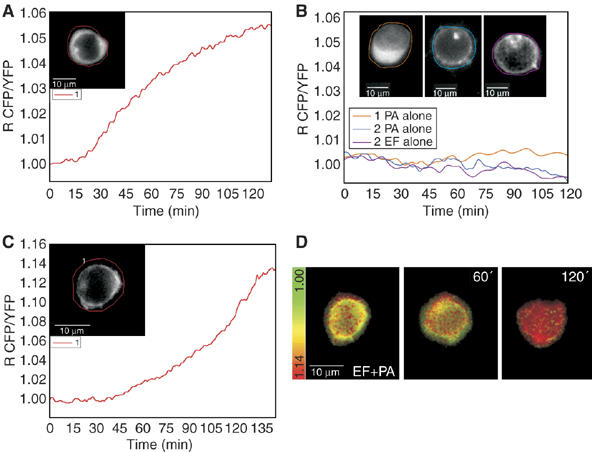
Figure 4.

Imaging of the EF-induced rise of cAMP with PKA fluorescent probes in Jurkat cells. Jurkat cells expressing the catalytic PKA subunit coupled to YFP and the regulatory PKA subunit coupled to CFP in the cytosol or in the plasma membrane depending on the presence of a membrane localization sequence were imaged after treatment with EF 10 nM+PA 20 nM (time zero). During microscopic observations, cells were maintained in 2 ml of a balanced salt solution inside a microscope-adapted micro-incubator at 37°C and constant 5% CO2 pressure. Images were acquired every 10 s and the ratio between CFP and YFP emissions was calculated. An increasing ratio corresponds to increasing cAMP concentrations. Similar traces were recorded in other cells and they do not depend on cell size. (A) Change of cAMP with time in a cell expressing the cytosolic probe; the inset shows the fluorescence of CFP at time O indicating a cytosolic distribution of the probe. (B) cAMP remains low in cells treated with PA only or EF only. This is revealed by both the cytosolic PKA fluorescent probe (orange trace corresponding to the cell of inset 1 which shows the CFP fluorescence at time 0) and by the membrane localized PKA probe (inset 2, blue trace, and inset 3, magenta trace, show the CFP fluorescence taken at time 0 of cells treated with PA or Ef, respectively). (C) The change of cAMP with time in a Jurkat cell expressing the membrane localized PKA probe; the inset shows the fluorescence of membrane-bound CFP at time O. (D) The Jurkat cell of (C) as pseudo-colours, which reflect the increasing cAMP concentration from green (low cAMP) to red (high cAMP) at the indicated time points of incubation with PA+EF.
