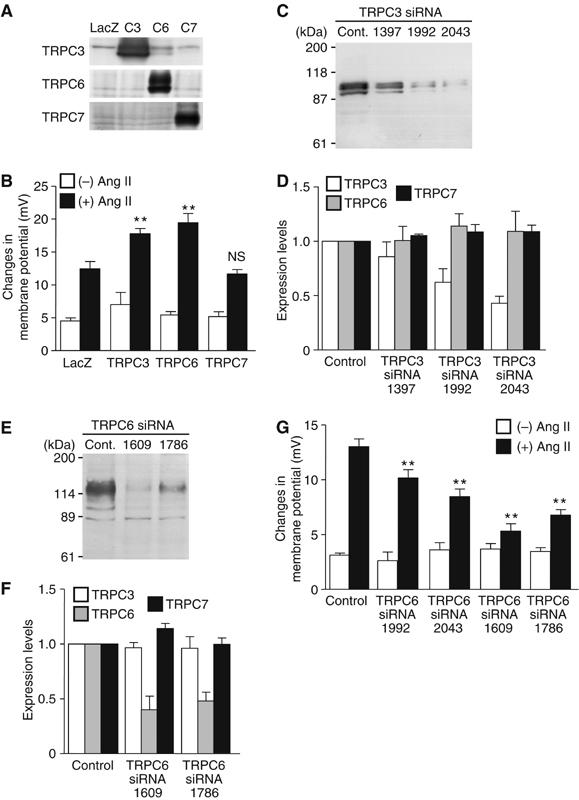
Figure 6.

Requirement of TRPC3 and TRPC6 in Ang II-induced increases in membrane potential. (A) Western blots of the respective TRPC proteins. To identify the sizes of TRPC3 (C3), TRPC6 (C6), and TRPC7 (C7), each TRPC was overexpressed with recombinant adenoviruses. (B) Potentiating effects of TRPC3 and TRPC6 on changes in membrane potential by Ang II stimulation in LacZ-, TRPC3-, TRPC6-, and TRPC7-expressing cells. **P<0.01 versus Ang II stimulation of LacZ-expressing cells. NS means no significance from LacZ-expressing cells. (C–F) Effects of TRPC3 siRNAs (C, D) and TRPC6 siRNAs (E, F) on the expression of the respective TRPC proteins. (C, E) Representative Western blots with anti-TRPC3 (C) and anti-TRPC6 (E). (D, F) Effects of siRNAs of TRPC3 and TRPC6 on the average expression of native TRPC3, TRPC6, and TRPC7 proteins. (G) Effects of siRNAs of TRPC3 and TRPC6 on the maximal changes in DiBAC4(3) fluorescence intensity by Ang II (100 nM). Data are shown as the changes in membrane potentials (mV) calculated by in vivo calibration. **P<0.01 versus Ang II stimulation of control siRNA-treated cells (Control).
