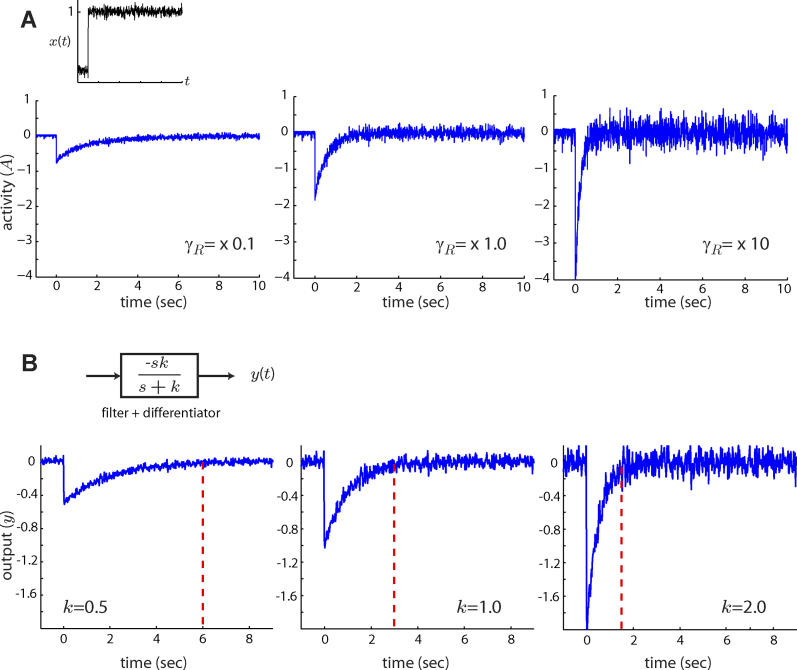
Figure 2. Effect of Adaptation Time on Filtering Capabilities.
(A) When subjected to an abrupt change in chemoattractant concentration (x(t)), the output (A(t)) of the model of the E. coli signaling pathway (Materials and Methods) responds with an initial transient burst which decays exponentially. The adaptation time depends on the component levels of the signaling pathway such as the methylation rate γR [13,14]. Faster methylation rates (γR) yield shorter adaptation times but result in noisier activity levels. Thus, the filtering capabilities of E. coli are determined by the time it takes to adapt to step inputs of ligand.
(B) The adaptation response of E. coli is representative of a system consisting of a low-pass filter (k/(s + k)) coupled with a differentiator (s) (inset). A negative gain is used here to mimic the activity response of E. coli to positive changes in ligand [38]. As in the case of the E. coli model, the output of the low-pass filter plus differentiator (y(t)) is a filtered version of the derivative of the input signal. Smaller filter cutoff frequencies (smaller k), which correspond to longer averaging times, yield less noisy outputs. Red dashed lines indicate the time it takes the mean output of the filter to reach 95% of its steady state level. Although longer averaging times help reduce noise, they result in a slower response: the output takes longer to approach zero after the step.

