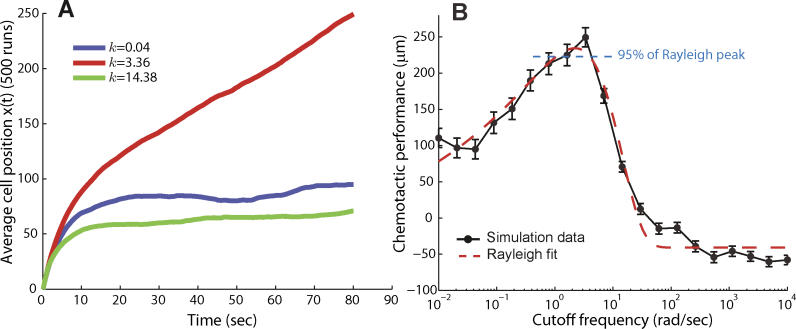
Figure 3. Effect of Adaptation Time on Chemotactic Efficiency.
Chemotaxis was simulated by assuming that the signaling pathway was approximated by the system of Figure 2B.
(A) Different choices of k, and hence different adaptation times, result in varying chemotaxis efficiency. For example, cells with cutoff frequencies of k = 0.04 rad/s and k = 14 rad/s moved approximately 90 μm and 70 μm along the chemoattractant gradient. In contrast, a cell with a cutoff frequency of 3.4 rad/s moved approximately 250 μm along the gradient.
(B) These simulations were repeated for a large range of cutoff frequencies. The resulting frequency-dependent chemotactic performance was fitted with a Rayleigh function to estimate the optimal cutoff frequency for chemotaxis (red dashed line). Chemotactic performance was based on the final position along the gradient after 80 s. Each point represents the average of 500 simulation runs, and vertical bars indicate mean plus or minus standard error of the mean. Rotational and translational diffusion coefficients of 0.16 rad2/s and 2.2 × 10⁻¹ μm2/s, respectively, were used. Nominal parameters used: u = 20 μm/s, RT = 2.5 μM, Kd = k −/k + = 100 μM, L 0 = 0.01 μM, and g = 0.2 μM/ μm.

