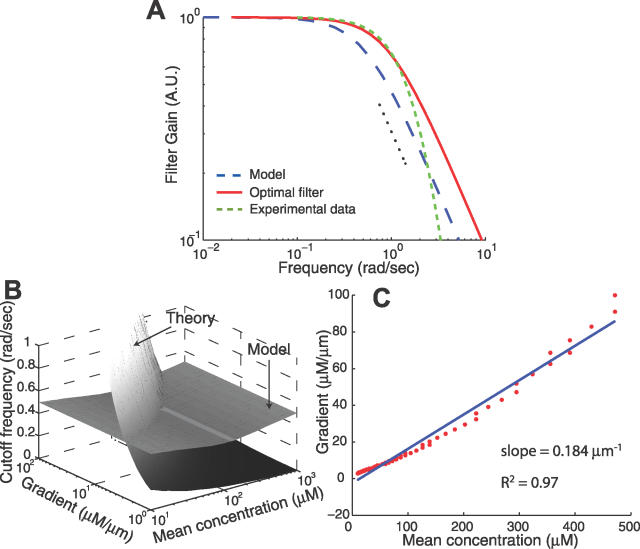
Figure 6. Frequency Dependence of the Signaling Response.
(A) The frequency-dependent filtering responses for the optimal filter (red solid line) and experimental data (green dashed line; [20]). The experimental data, obtained as the Fourier transform of the response of cells to an impulse of chemoattractant [20] and adjusted to remove the differentiator and downstream phosphorylation cascade (Materials and Methods), also exhibits the characteristics of a low-pass filter. Parameters used for the theoretical filter shown here are L 0 = 1 μM, g = 1.5 μM/μm, and u = 20 μm/s. Also included is the frequency response of the model (blue dashed line) linearized about a ligand input of L 0 = 1 μM. The dotted black line shows a dependency of (frequency)−1.
(B) The predicted optimal cutoff frequency is compared with that of the filter for a range of chemoattractant gradients and mean concentrations. The line through which both surfaces intersect represents the chemoattractant profiles for which E. coli filters out disturbances optimally with respect to the parameters used for the model.
(C) Plot of the concentration gradient against mean concentration for the points where the surfaces in (B) intersect. The linear dependence suggests that E. coli is conditioned for optimal filtering in chemoattractant concentration profiles of constant relative gradient.

