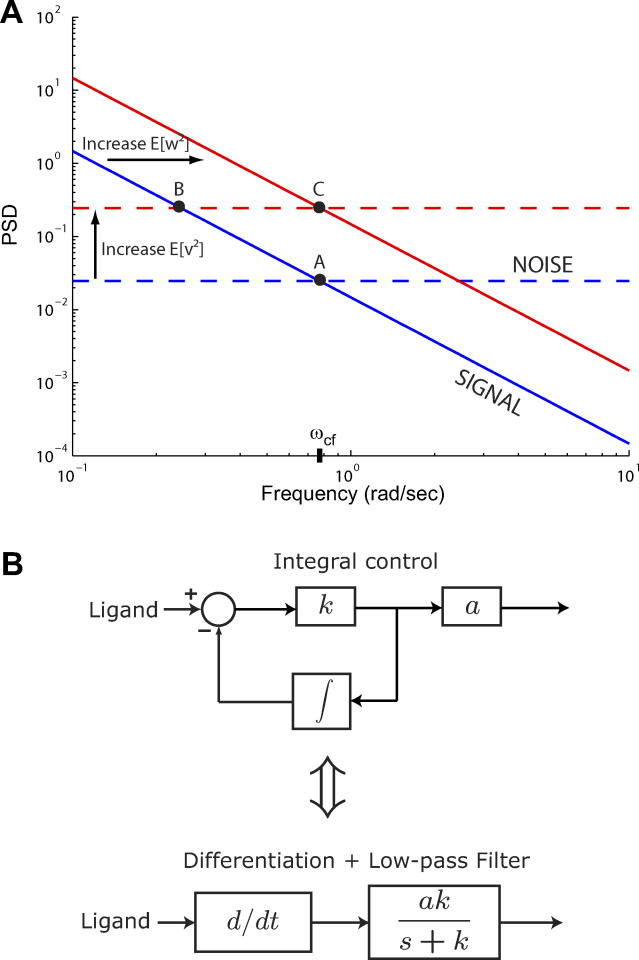
Figure 7. Optimal Filtering Cutoff Frequency Is Determined by the Signal and Noise.
(A) Insight into the relevant features of the optimal estimator can be obtained by considering a simplified model that assumes the cell measures L + v, where L is the true ligand concentration. The system dL/dt = w acts as an integrator and has signal PSD dependent on the rotational diffusion coefficient (blue solid line). The observed signal L + v includes the effect of the binding noise v which is assumed to be a white noise process (blue dashed line). For this model, the optimal filter for the estimation of L, given L + v, is a first-order, low-pass filter with a cutoff frequency (ωcf) related to the covariances of w and v: (Protocol S1). Graphically, this is determined by the intersection of the signal and noise PSDs (point A). Increasing the noise variance (red dashed line) decreases the optimal cutoff frequency because the filter must become more restrictive to eliminate the additional noise (point B). If the signal PSD is then increased (red solid line), for example, by increasing the effect of rotational diffusion, the cutoff frequency increases (point C). Parameters used for point A: u = 20 μm/s, Dr = 0.16 rad2/s, τ = 1 s, RT = 2.5 μM, k
−/k
+ = 100 μM, g = 0.03 μM/μm, and binding is assumed at steady state with a ligand value of L
0 = 1 μM.
(B) Block diagram representation of the chemotactic system. A system using an integral control feedback mechanism (top) is functionally equivalent to one consisting of the series connection of a differentiator and a first-order low-pass filter. In the chemotaxis pathway, this subsystem is followed by a conversion function of CheYp to the running bias.

